REST API
REST API monitor regularly checks the availability and response of your REST API endpoints over IPv4 or IPv6 enabled locations and alerts you if the API response values does not validate against the specified RegEx/XPath/JSONPath assertions. Additionally, test and validate your JSON response against the JSON schema specified by you. To bulk import REST API endpoints, simply upload your predefined HAR/Swagger (JSON)/ CSV file into Site24x7.
Add REST API Monitor
- Login to Site24x7.
- Click Admin > Inventory > Monitors > Add Monitor.
- Select REST API in Add Monitor page.
- Specify the following details to add the REST API monitor:
- Display Name: Provide an appropriate name for the website which you want to monitor.
- Endpoint URL: Enter the REST endpoint URL to be monitored. The URL can be an HTTP/HTTPS address or a cURL command.
- Check Frequency: Choose the required poll frequency. The frequency can be set from 10 seconds to one day. The frequencies of 10, 15, and 30 seconds can be configured if you're using Enterprise, Enterprise Web, Enterprise Plus Web, Elite, Elite Web Packs, Team 2024, Team, Team Web, and MSP. For all other users, one minute will be the minimum supported check frequency.
Note
- Configuring a 30-second check frequency will consume the license of two basic monitors.
- Configuring a 15-second poll frequency will consume the license of four basic monitors and can be configured only with the On-Premise Poller locations.
- Configuring a 10-second poll frequency will consume the license of six basic monitors and can be configured only with the On-Premise Poller locations.
- Monitoring locations: Select a location profile from the dropdown list from where the website will be monitored. The monitors with 10-second and 15-second poll frequencies will be supported only with On-Premise Poller locations.
To know more, refer Location Profile.

- Specify the following details under Advanced Configuration:
- Connection Timeout: Specify time in seconds the connection need to establish with the target server.
- Prefer IPv6: If you want to monitor your endpoint URL over IPv6 enabled locations, simply move the rocker button to "YES" when creating or editing a monitor form.
Note
- Site24x7 lets you monitor your dual-stacked IPv4/IPv6 based infrastructure as per you need. IPv4 will be enabled as the default protocol. You'll be able to monitor your IPv6 infrastructure, once you enable the rocker button to IPv6. If the connectivity over IPv6 fails, it will not fall back to IPv4 automatically. Read more.
- Enabling IPv6 in the monitoring form doesn't make it compatible to monitor IPv4, by default. If you want to monitor a resource, which is compatible with both IPv4 and IPv6–you'll have to set up two separate monitor checks for this.
- Store Data Fields: Check the HTTP Headers and the Response Content boxes if you wish to store the data for every data collection.
This field allows you to select the data that will be sent to AppLogs during each data collection. By clicking the respective entry of the Log Report, the selected data will appear in the Collection Summary report under the respective Log Report entry.
Note- Enabling the HTTP Headers and Response Content will store and retrieve your data in the AppLogs and display it in the Collection Summary report.
- The whole stored data can be viewed in the App Log query console, and you can perform query actions on the stored data.
- The data stored in AppLogs will consume an AppLogs license based on its size.

- Monitor Groups: You can associate your monitor with multiple monitor groups by selecting the relevant monitor groups from the drop down list. This allows in logical grouping of your monitors.
To learn how to create a monitor group for your monitors, refer Monitor Groups. - Dependent on Monitor: Select a monitor from the drop-down list to choose it as your dependent resource. You can add up to 5 monitors as dependent resources. Alerts to your monitor will be suppressed based on the DOWN status of your dependent resource.
Note- Configuring a dependent resource and suppressing alerts based on the dependent resource's status is part of providing you with better false alerts protection. Learn more about alert suppression at monitor level.
- If you select "None" in the dependent resource field, alerting will progress as per your normal configuration settings. No alerts will be suppressed in this case as the monitor doesn't have any dependent resource.
- Multiple monitor group support for monitors allow a monitor to be associated with multiple dependent resources in different monitor groups. If during a normal monitor status check, any one of these dependent resources' status is identified as DOWN, the alert for the monitor will be automatically suppressed. However, the dependency configuration at monitor level is always given the higher priority over any other monitor group level dependency configuration for suppressing alerts.
- Specify the following details for HTTP Configuration:
- HTTP Method: Specify the method to be used for connecting with the site–POST, GET, PUT, DELETE, and PATCH. Select the appropriate option from the drop-down to configure your form submission method. Also, select the appropriate body type for POST, PUT, PATCH HTTP, and PROPFIND methods.
NoteTo use a credential profile in HTTP Configurations, type $ and a list of available credential profiles will appear—select the desired one from this list. Learn more about credential profiles.
Monitoring WebDav APIs
Web Distributed Authoring and Versioning, or WebDAV, is a protocol that allows users to edit, share, copy, or move documents through an HTTP web server.
The following primary HTTP methods that are used by WebDAV are currently supported in Site24x7:- PROPFIND
- PROPPATCH
- MKCOL
- COPY
- MOVE
- LOCK
- UNLOCK
By using these methods, you can now perform:
Calendar API monitoring
Calendaring extension to WebDAV, or CalDAV, is an extension of WebDAV that allows users to access or manage calendar-related information on a remote server. It uses the iCalendar format. Using CalDAV, you can synchronize data across devices, retrieve calendar events, schedule new events, set reminders, etc. Examples: Google Calendar and Apple Calendar provide CalDAV access to their services.Contact API monitoring
vCard extension to the WebDAV or CardDav is an address book client or server protocol that allows users to access or share data on a web server. It uses the vCard format for the data. CardDAV helps to retrieve, store, and manage personal contact-related information over a remote server. Examples: Google Contacts and Apple's iCloud Contacts use CardDAV.NotePOST method would submit the parameters to access the URL. POST submission method supports request sending in FORM, Text, XML, or JSON formats.
NoteIn the GET method, the entire HTML response is fetched and checked for the presence of your configured keywords.
- Parameter Type: Choose GraphQL if you wish to define the GraphQL query to be sent to the endpoint.
- GraphQL Query: Provide the GraphQL query to obtain the specific fields in response from the GraphQL-based API service.
- GraphQL Variables: Specify the values of the variables referred to in the GraphQL query in JSON format.
NoteGraphQL query and GraphQL variables will be included in the request body if you're choosing the POST method. In the case of the GET method, the GraphQL query and GraphQL variables will be sent through URL Parameters.
- HTTP Request Headers: Sometimes, you might want to customize the default HTTP request header information. In such cases, the additional header name and header value can be added here.
- User Agent: Set a customized user agent (web browser) for sending your request and the HTTP headers. You can choose from the available user agents.
- Authentication Method: Manage multiple authorization methods for your monitors.
- Basic/NTLM: Configure your Basic/NTLM-based authorization. Windows NTLM is the authentication protocol used on systems running on Windows.
- Web Credentials: Choose your web credentials for URLs requiring Basic/NTLM-based authentication from the drop-down. Learn how to add/ edit credentials.

- Web Credentials: Choose your web credentials for URLs requiring Basic/NTLM-based authentication from the drop-down. Learn how to add/ edit credentials.
- Kerberos/Negotiation: If you are monitoring a resource secured by Kerberos authentication, select the Kerberos/Negotiation from the drop-down menu.
- Kerberos Authentication: Select the Kerberos credential profile from your preconfigured list or create a new Kerberos authentication profile by clicking the (+) button.
Note- Kerberos authentication is supported only for On-Premise Poller locations.
- Learn how to configure a Kerberos credential profile.
- Kerberos Authentication: Select the Kerberos credential profile from your preconfigured list or create a new Kerberos authentication profile by clicking the (+) button.
- OAuth: Pick the OAuth from the drop-down menu, if you're monitoring a resource that is secured by OAuth framework.
- OAuth Provider Name: Select the OAuth Provider Name from your preconfigured list or create a new OAuth profile by clicking the + button.
NoteLearn how to configure an OAuth Provider.
- OAuth Provider Name: Select the OAuth Provider Name from your preconfigured list or create a new OAuth profile by clicking the + button.
- Web Token: Register Site24x7 with your authentication server to monitor protected resources using web tokens.
- Web Token Name: Select the Web Token Name from your preconfigured list or create a new Web Token profile by clicking the + button.
NoteLearn how to add a Web Token.
- Web Token Name: Select the Web Token Name from your preconfigured list or create a new Web Token profile by clicking the + button.
-
AWS Signature: Choose an appropriate Amazon account that is already integrated with Site24x7 from the drop-down. This helps in signing the API request using HMAC to authenticate the API hosted on the AWS APIGateway. Learn how to integrate Amazon account.
NoteRead to learn more about AWS Signature authentication.
- GCP Service Account Key: Select the GCP Service Account Key from the drop-down menu to monitor Google Cloud Project APIs, such as Pub/Sub, that require authentication through Google Cloud's Service Account.
- GCP Service Account: Select the appropriate GCP monitor that has already been added using the GCP Service Account Key JSON file or add a new GCP monitor by clicking the + button and upload the relevant GCP Service Account Key JSON file.
NoteLearn how to configure a GCP Monitor.
- GCP Service Account: Select the appropriate GCP monitor that has already been added using the GCP Service Account Key JSON file or add a new GCP monitor by clicking the + button and upload the relevant GCP Service Account Key JSON file.
- Basic/NTLM: Configure your Basic/NTLM-based authorization. Windows NTLM is the authentication protocol used on systems running on Windows.
- Client Certificate: For websites that require client certificate authentication, upload the client certificate (has to be a PKCS#12 file.)

- Query Authoritative Name Server: Use the toggle button to decide if you want to resolve your domain name by an authoritative name server.
- Accepted HTTP Status Codes: Provide a comma-separated list of HTTP status codes that indicate a successful response. You can specify individual status codes, as well as ranges separated with a colon. Learn more about Accepted HTTP status codes.
- SSL Protocol: Specify the version number of the TLS/SSL protocol (TLSv1.3, TLSv1.2, TLSv1.1, TLSv1 and SSLv3 supported) to validate proper SSL handshake. Use Auto mode to enable automatic detection and negotiation.
Note
SSL Protocol validation works only for HTTPS domains. If you've specified a different SSL protocol version than the actual one, the monitor status fails during the poll.
- HTTP Protocol: Choose the preferred version of the application-layer protocol (HTTP/1.1 or HTTP/2) to be used for negotiation.
- Enable ALPN: Enable ALPN to ensure that only supported application protocols are sent as part of the TLS handshake and ensure reduced round trip time. By default, it'll be set to Yes. Enable ALPN option isn't supported by On-Premise Poller. We'll be extending the support in the next update
- HTTP Method: Specify the method to be used for connecting with the site–POST, GET, PUT, DELETE, and PATCH. Select the appropriate option from the drop-down to configure your form submission method. Also, select the appropriate body type for POST, PUT, PATCH HTTP, and PROPFIND methods.
- Check Availability: Once you fill in all the mandatory details related to configuration, you can use the option to test the configurations you've created. Service testing helps you to drill deep into code and get hands-on experience.
- Specify the following details for Content Checks:
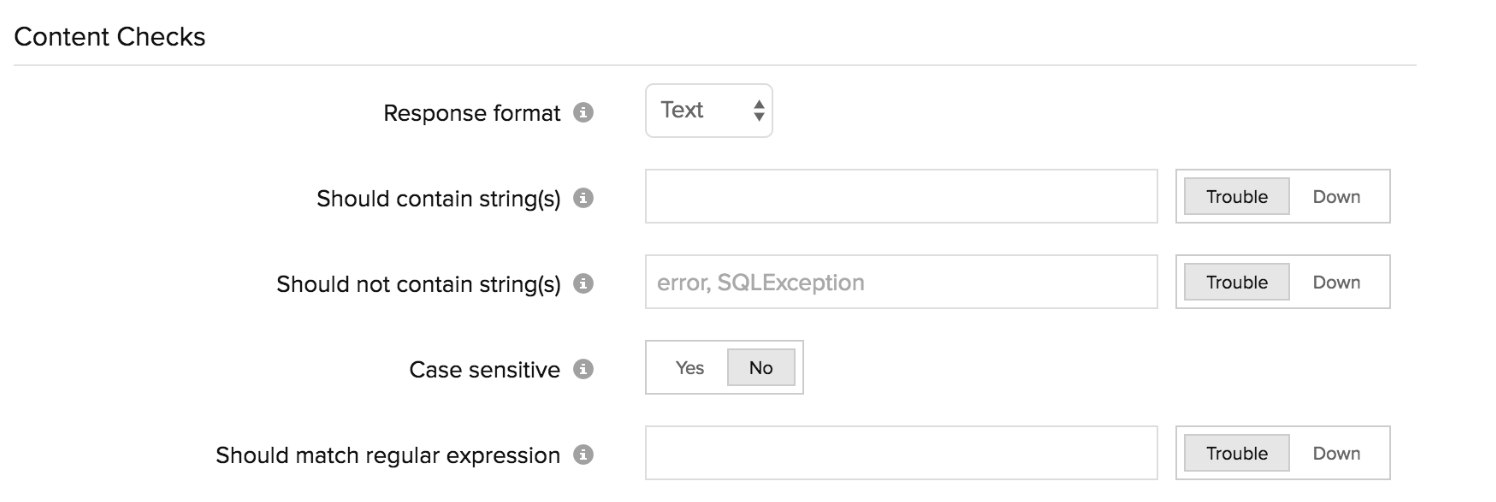
Choose the response format of your preference.
- If the selected Response format is Text
- Should contain string(s): Get alerted when the specified keywords are not present in the website. Mention the keywords in the check box and use the slider button to trigger the required kind of alert.
- Should not contain string(s): Get alerted when the specified keywords are present in the website content. Mention the keywords in the check box and use the slider button to trigger the required kind of alert.
NoteYou must adhere to the following conditions while adding keywords in the given field:
- A single string or keyword can be configured with/without any double quotes (ex: HTML).
- When you are choosing text as the response format, it can be configured in the below format, “{\”cache\":\"success\",\"WSF\":\"success\",\"bean\":\"success\",\"DB\":\"success\"}"
- If there are two strings, which comprise a single keyword–add a space in between the two strings and enclose it with double quotes. (ex: "HTML response").
- In case you have more than a couple of individual keywords configured, you will have to separate them with a space and also use double quotes for each of them ("monitor" "HTML").
- Case sensitive: Enable the toggle button for this option.
- Should match regular expression: Configure your alert based on whether a particular pattern matches with the website content. For example when you consider the expression ^[a-z0-9_-]{3,15}$, your website content should contain alphabets from a to z,numbers from 0 to 9 , underscore and a hyphen. Also there should be minimum length of 3 characters and maximum length of 15 characters. When it is not matched, your website will be reported as "Regular expression"^[a-z0-9_-]{3,15}$" does not match" as a reason.
Note
Learn more about content checks and negative lookaheads in regular expression match.

- If the selected Response format is XML
- XPath expression: Provide XPath expression to enable the evaluation of XPath expression assertion. The assertion must successfully parse the XPath in the XML to throw a success. You can add multiple XML expression assertions by clicking the "+" key.
- XPath Severity: Specify the Alert Severity as "DOWN or TROUBLE" to decide the status when the specified XPath expression assertion fails due to a mismatch.
- XPath or XML Path Language is a query language for selecting nodes from an XML document. Use the Site24x7 XPath Evaluator for more help.

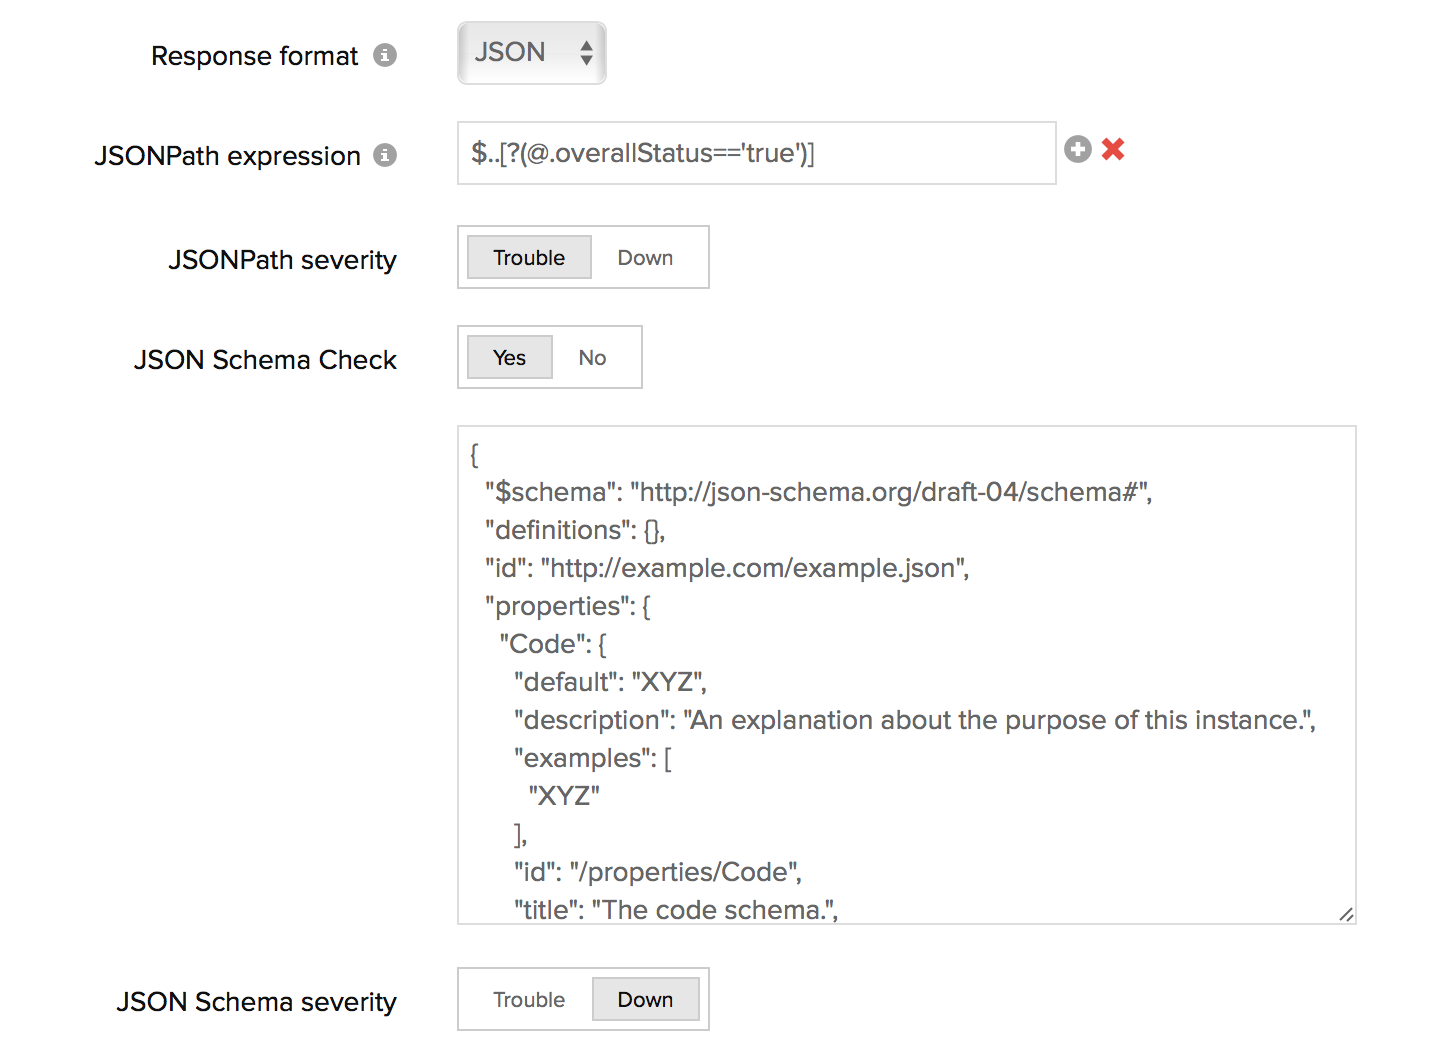
- If the selected Response format is JSON
- JSONPath expression: You can specify a JSONPath assertion and test an expected data in the JSON response. For a successful test, the assertion must successfully parse the JSON Path in the JSON. If you need help to build a JSONPath assertion to test against your JSON response, you can use Site24x7 JSONpath expression for help. You can always add multiple such JSONPath assertions to test individual use cases. Use the "+" key to add more expression assertions.
NoteWhenever an assertion is processed, the target value in your JSON assertion compares the actual value in the JSON Response to check multiple test scenarios. Common test scenarios that can be checked include:
- Actual value is empty
- Actual value is not empty
- Actual value equals the target value
- Validates that the actual value is greater than or equal to the target value
- Validates that the actual value is less than or equal to the target value
- Actual value contains target value as substring
- Target value is not contained in the actual value

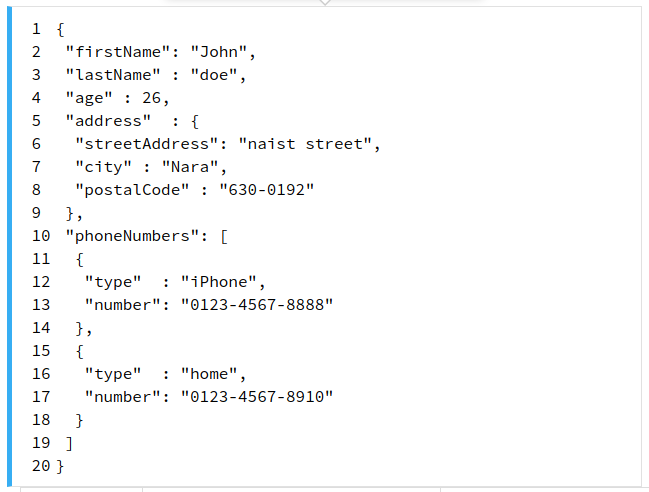
JSONPath Expression Description Status $.address.city Select the value of 'city' property which is the direct child of 'address' property. Status is Up. City property is the direct child of address property $.address.country
Select the value of 'country' property which is the direct child of 'address' property. Status is Down. There is no child with property 'country' for address property.
$..type Select the value of all the 'type' properties in the input json. Status is Up. The response json has 'type' property as its child.
$.address.length() Select the length of the 'address' property.
Status is Up. Address property is present in the response json.
$..* Select all the properties and its value. Status is Up. Response JSON has more than one property. If the JSON response has no property in it then the monitor will report outage.
$.phoneNumbers[1] Select the 2nd value from the 'phoneNumbers' array. Status UP if there are 2 or more child entities for the phoneNumber property. $.phoneNumbers[?(@.number)] Select the 'phoneNumbers' property if it has 'number' property within it. Status will be Up, if the phoneNumber property includes at least a child with number property. $.phoneNumbers[?(@.type ==\"iPhone\")] Select the 'phoneNumbers' property the 'type' is iPhone. Status will be UP if the phoneNumber property includes at least a childr with property type as iPhone. $[?(@.age > 20)] Select the JSON objects if the 'age' is greater than 20.
Status will be UP if the age property value is greater than 20. - JSONPath expression: You can specify a JSONPath assertion and test an expected data in the JSON response. For a successful test, the assertion must successfully parse the JSON Path in the JSON. If you need help to build a JSONPath assertion to test against your JSON response, you can use Site24x7 JSONpath expression for help. You can always add multiple such JSONPath assertions to test individual use cases. Use the "+" key to add more expression assertions.
- If the selected Response format is Text
- JSONPath severity: You can specify the Alert Severity as "DOWN or TROUBLE". When the JSONPath assertion fails during a test, an alert will be automatically triggered.
- JSON Schema Check: JSON Schema is a vocabulary that allows you to annotate and validate all JSON endpoints for your web service. To test the HTTP response data against the schema, enable the rocker button to YES and post the JSON schema validation assertion in the text field. In case you've kept the text field empty after selecting the rocker button to YES, the data collection will still occur as usual without any impact on the overall monitor status.
- JSON Schema severity: You can specify the Alert Severity as "DOWN or TROUBLE". When the JSON Schema validation fails during a content check, an alert will be automatically triggered based on your setting.
NoteBelow are the common use cases tested when the API responses are validated against the defined JSON schema:
- Verifying whether values are of a certain type (e.g. integer, string, etc.)
- Ensuring the API JSON responses are structured properly
- Checking for the existence of the required keys in the JSON response
- Test whether an incorrect HTTP response (like an HTML or XML) validates against your given JSON schema.

- Should contain HTTP Response Headers: Enter the desired response header and values for your HTTP request and verify whether the HTTP headers are present or the values match with the desired response. Trigger a trouble or down alert during a check failure.
While configuring the response header check, you must add values based on the following conditions:- You can add multiple headers and each header can accept multiple values.
- A single value can be configured with/without any double quotes (eg.: keep-alive or "keep-alive").
- In case you have multiple header values configured, you will have to separate them with a space and also use double quotes for each of them. (eg., "gzip" "br").
- Header value can also support regex validation. The regex pattern should be "${
}". For example : ${\d{4}} can be used to search for four continuous digit numerical value in the value of the header configured in the header name.
- HTTP Response Header Severity: Use the toggle button to specify the Alert Severity as DOWN or TROUBLE. When the test fails, an alert will be automatically triggered.

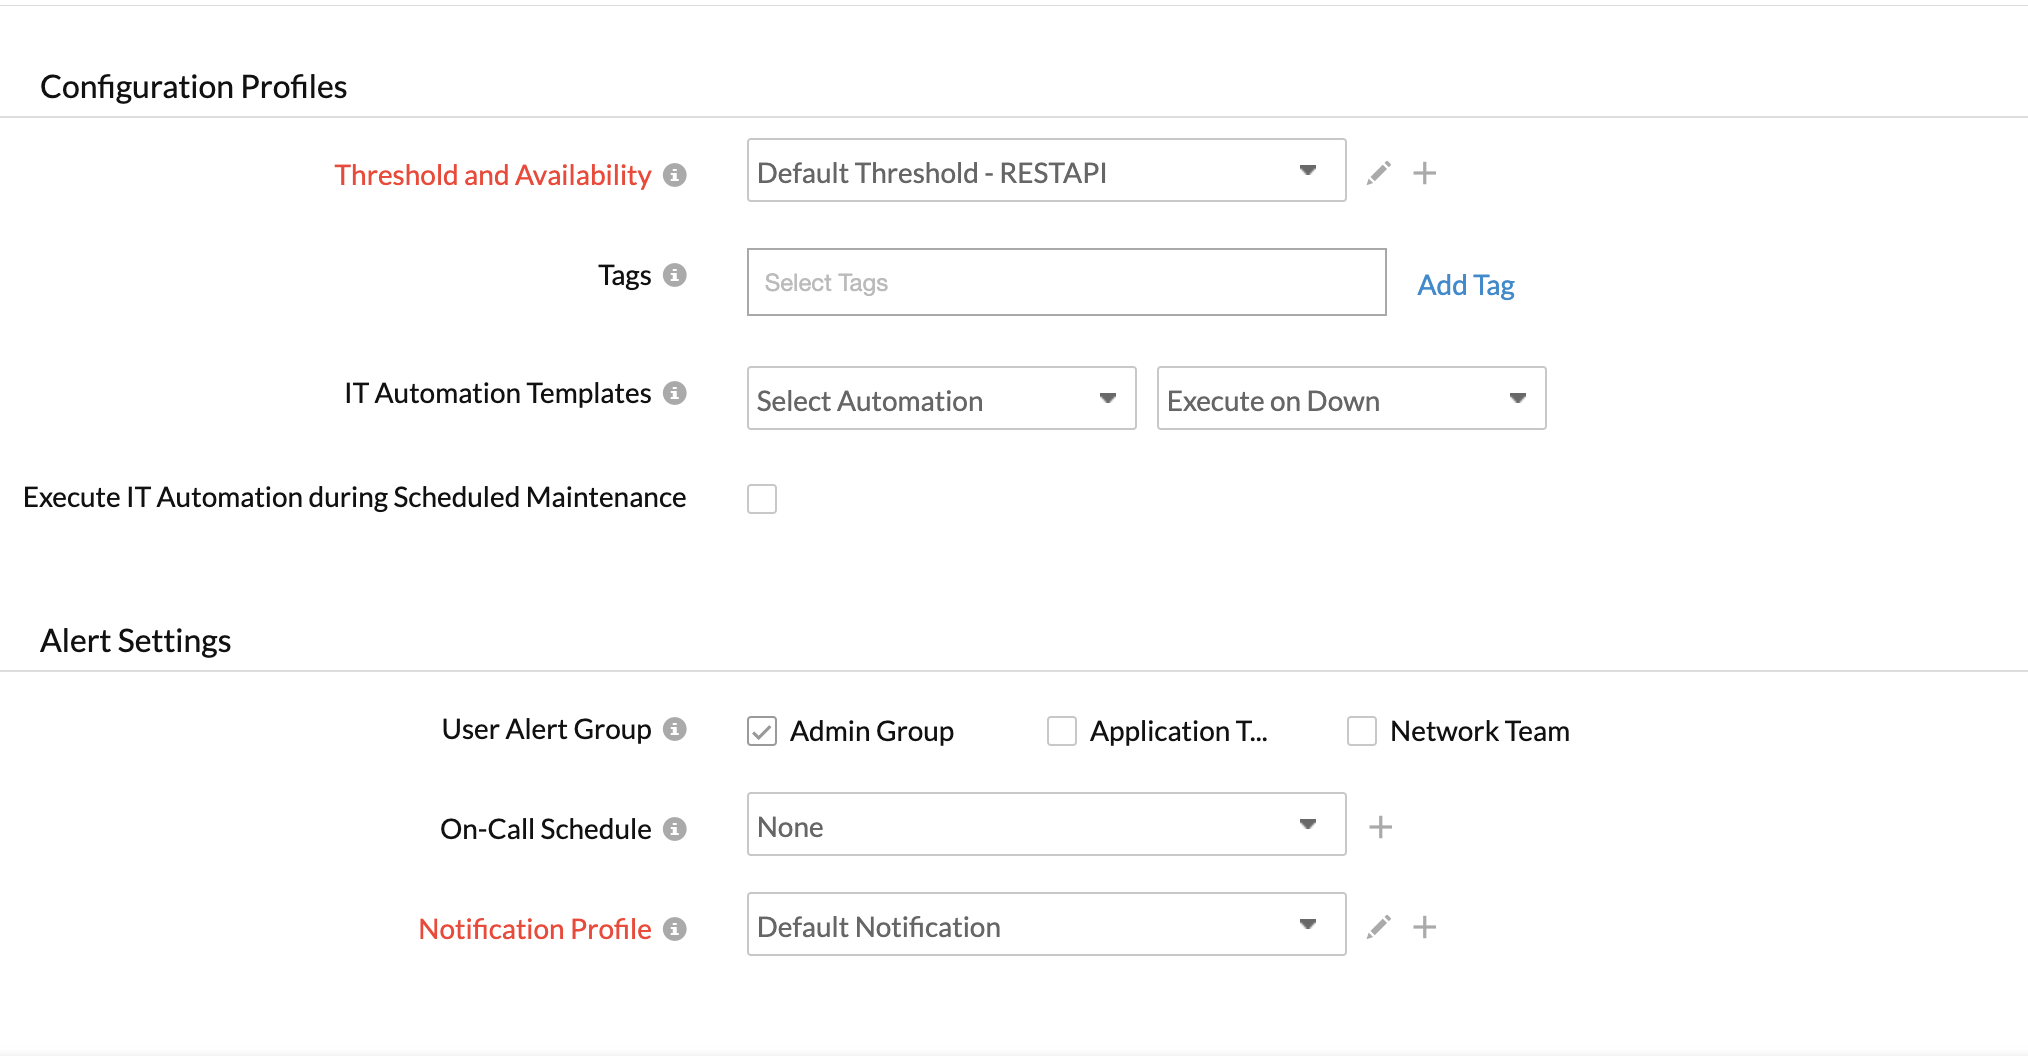
- Specify the following details for Configuration Profiles:
- Threshold and Availability: Select a threshold profile from the drop down list or choose the default threshold set available and get notified when the resources cross the configured threshold and availability.
To create a customized threshold and availability profile, refer Threshold and Availability. - Tags: Associate your monitor with predefined Tag(s) to help organize and manage your monitors creatively. Learn how to add Tags.
- IT Automation: Select an automation to be executed when the website is down/trouble/up/any status change/any attribute change. The defined action gets executed when there is a state change and selected user groups are alerted.
To automate corrective actions on failure, refer IT Automation.

- Threshold and Availability: Select a threshold profile from the drop down list or choose the default threshold set available and get notified when the resources cross the configured threshold and availability.
- Alert Settings:
- User Alert Group: Select the user group that need to be alerted during a outage.To add multiple users in a group, see User Alert Group.
- On-Call Schedule: The On-Call Schedule option helps you to ensure that the notifications are sent to assignees in specific shift hours helping them to quickly respond to alerts or incidents. Choose an On-Call of your preference from the drop-down.
- Notification Profile: Choose a notification profile from the drop down or select the default profile available. Notification profile helps to configure when and who needs to be notified in case of downtime. Refer Notification Profile to create a customized notification profile.
NoteYou can receive alerts if the monitors are associated to user groups irrespective of the On-Call shift you've configured.
- Third-Party Integrations: Associate your monitor with a pre-configured third-party service. It lets you push your monitor alarms to selected services and facilitate improved incident management.If you haven't setup any integrations yet, navigate across to ”Admin > Third Party Integration” to create one. Tell me more.
- Click Save. You can click Check and Save if you want to run the configurations and seewhether the monitor is performing well and then get the monitor saved. In case of an error, the monitor will not be saved.
NoteOnce the monitor setup is completed, Site24x7 deep discovery wizard scans your domain and auto detects all related internet resources for your domain that can be added to your account for a comprehensive internet services monitoring. Explore more about internet services deep discovery.
- Learn more about the various performance metrics of a REST API Monitor. Also learn about REST API Transaction Monitor, which lets you monitor upto 25 API endpoints at a minimum check frequency of 10 minutes. Read our webpage to know all about Site24x7's REST API monitoring tool.
Troubleshooting Tips:
- The format of POST in a REST API monitor
- Can I look at the output/response time of the REST API monitoring polls
- In a REST API monitor, I’m using a POST HTTP Method with a JSON request body. In the content match with a JSON response type, can I undertake a second level validation along with first level validation
- Can I configure multiple REST APIs in a single REST API monitor
