REST API Transaction
Modern web applications are composed of web pages that rely heavily on large number of REST API calls to retrieve data or perform specific actions. A mobile application communicates primarily with REST API calls, and may use web pages in-between for login. At times even workflows on a web page cannot be completed without performing an AJAX request. Hence, monitoring a web application based on page navigation and form parameters alone is also no longer sufficient. Site24x7's REST API Transaction Monitor has the ability to monitor workflows in REST applications. You can create a monitor directly from the Site24x7 web client without requiring any recorder. Once the monitor is setup, each transaction step will either be an HTML request or a REST API call. It performs synthetic monitoring of web application workflows without the overhead of running a real browser. You can monitor a sequence of 60 endpoint URLs and even allow parameter forwarding in your step sequence. Parameter forwarding lets capture the transaction to fetch the token parameter from the service, and pass it to any successive steps of the same monitor in order to successfully validate the endpoint.
You can monitor your IPv4- and IPv6-enabled applications using our 130 global monitoring stations. The REST API Transaction Monitor is classified as a Basic Monitor according to our pricing structure. Each set of five steps in the monitor will use one Basic Monitor license. For example, if a monitor has 10 transaction steps, the first five steps will consume one license, while the next five steps will use another Basic Monitor license.
Key Facets of the Dynamic UI
- Step-based monitoring: Ability to create a step, specify endpoint URL and monitor a web application as a sequence of steps.
- Session cookies: The entire sequence of steps is executed in the same HTTP session. Hence, authentication cookies or other cookie data set by the application will be available in subsequent steps too.
- HTTP Methods: Simulate any kind of HTTP Requests. Submit POST data as a FORM, Plain text, XML or JSON.
- Response Validation: Validate plain text responses with string checks for keywords or regular expressions. XML or JSON responses using XPath and JSONPath respectively
- Parameter Forwarding: Extract values from the Text, JSONPath or XPath expression responses and store them as custom parameters. Use these parameters to build custom query strings or POST data for subsequent steps.
- Basic/NTLM, OAuth 2.0 and Web Token Support: Authenticate Site24x7 to your application using Basic/NTLM credentials, OAuth 2.0. For OAuth 2 or by registering your Web Tokens, and monitoring will be performed using access token granted to Site24x7.
Configuring REST API Transaction Monitor
Group one or more API requests and execute them sequentially to evaluate the uptime, performance and correctness of your endpoint APIs. For each step in the transaction, you can define specific expression assertions and further validate the response data. Also, you can extract and save parameters from your response and use the data in subsequent requests or steps. Enter General Setting configurations, Transaction Steps, Configuration Profile details and also integrate with any Third-Party applications to complete your REST API Transaction monitor setup.
General Settings
- Login to Site24x7 web client.
- Access Admin > Inventory > Add Monitor > REST API Transaction
- Provide the following general setting details:
- Display Name: Provide an appropriate name for the web application that you want to monitor.
- Check Frequency: Choose the polling frequency as per your monitoring needs. You can set a minimum poll frequency of 5 minutes and a maximum of 1 day.
- Monitoring Locations: Choose your default global location profile from the dropdown list to setup monitoring of your web application from these locations. Additionally, customize and create location profiles based on your requirements.
NoteMonitor from upto 16 global locations. You can configure an On-Premise Poller to setup a monitoring location behind your firewall. Learn how to customize your Location Profile.
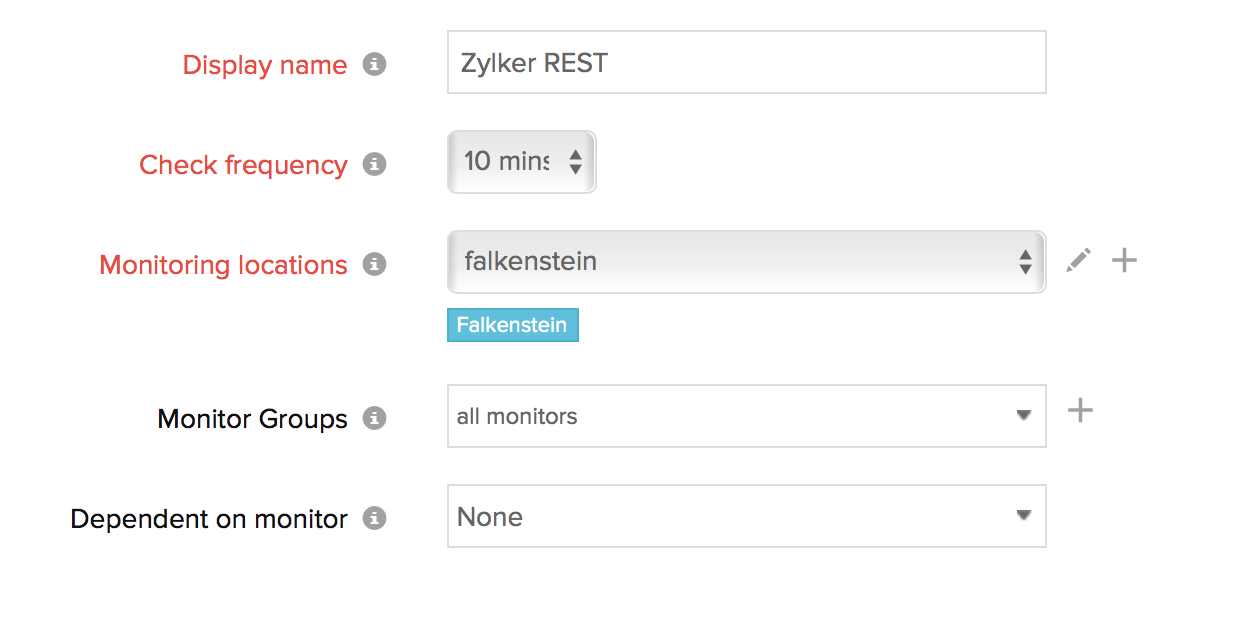
- Monitor Group(s): Enable logical grouping of your monitor with Monitor Groups. You can associate your REST API Transaction monitor with multiple monitor groups.
NoteLearn how to create a Monitor Group, refer Monitor Groups.
- Dependent on Monitor: Select a monitor from the drop-down list as your dependent resource. You can add up to 5 monitors as dependent resources. Alerts to your monitor will be suppressed based on the DOWN status of your dependent resource.
Note- Configuring a dependent resource and suppressing alerts based on the dependent resource's status is part of providing you with better false alerts protection. Learn more about alert suppression at monitor level.
- If you select None in the dependent resource field, alerting will progress as per your normal configuration settings. No alerts will be suppressed in this case as the monitor doesn't have any dependent resource.
- Multiple monitor group support for monitors allow a monitor to be associated with multiple dependent resources in different monitor groups. If during a normal monitor status check, any one of these dependent resources' status is identified as DOWN, the alert for the monitor will be automatically suppressed. However, the dependency configuration at monitor level is always given the higher priority over any other monitor group level dependency configuration while suppressing alerts.
Add New Transaction Step(s)
You can monitor a REST based web application as a sequence of steps. For example, you can first retrieve a web page, then perform REST API calls with values present in the page. To monitor a mobile application, you must first execute a login web view to extract an authentication token, then use the token for REST API calls. You can add upto 60 transaction step(s), with each step monitoring individual API endpoint. Once a new step is created, you can click the (+) symbol listed against the current transction step ribbon to Insert New Step. Doing this will clone the step configuration settings completely and create a new step for you. You can edit the step as per you need. You can also rearrange the transaction steps in your desired order using the  icons. If you wish to create an all new transaction step from scratch, please follow the steps listed below:
- Click Add Step under Transaction Steps. You're now prompted with an Add Step form. You can provide your transaction step URL or API endpoint URL that you wish to monitor here.
NoteYou can alternatively setup transaction steps by importing your predefined test cases defined in Swagger/OpenAPI specification (JSON) and HTTP Archive (HAR) Format.
- Specify the following Step Details in the Add Step form:
- Step name: Provide a unique name for your transaction step.
- Endpoint URL: Enter the REST endpoint URL to be monitored. The URL can be an HTTP/HTTPS address or a cURL command.

Smart Configuration
Smart configuration lets you automatically populate all the relevant form fields like Endpoint URL and header parameters while configuring your transaction step. This will expedite the monitor configuration process and facilitate in fine-tuning your API requests with the right header resources. You have to simply extract request headers using web browsers like Chrome and Firefox, and paste your copied request headers in the Import from request headers text field.
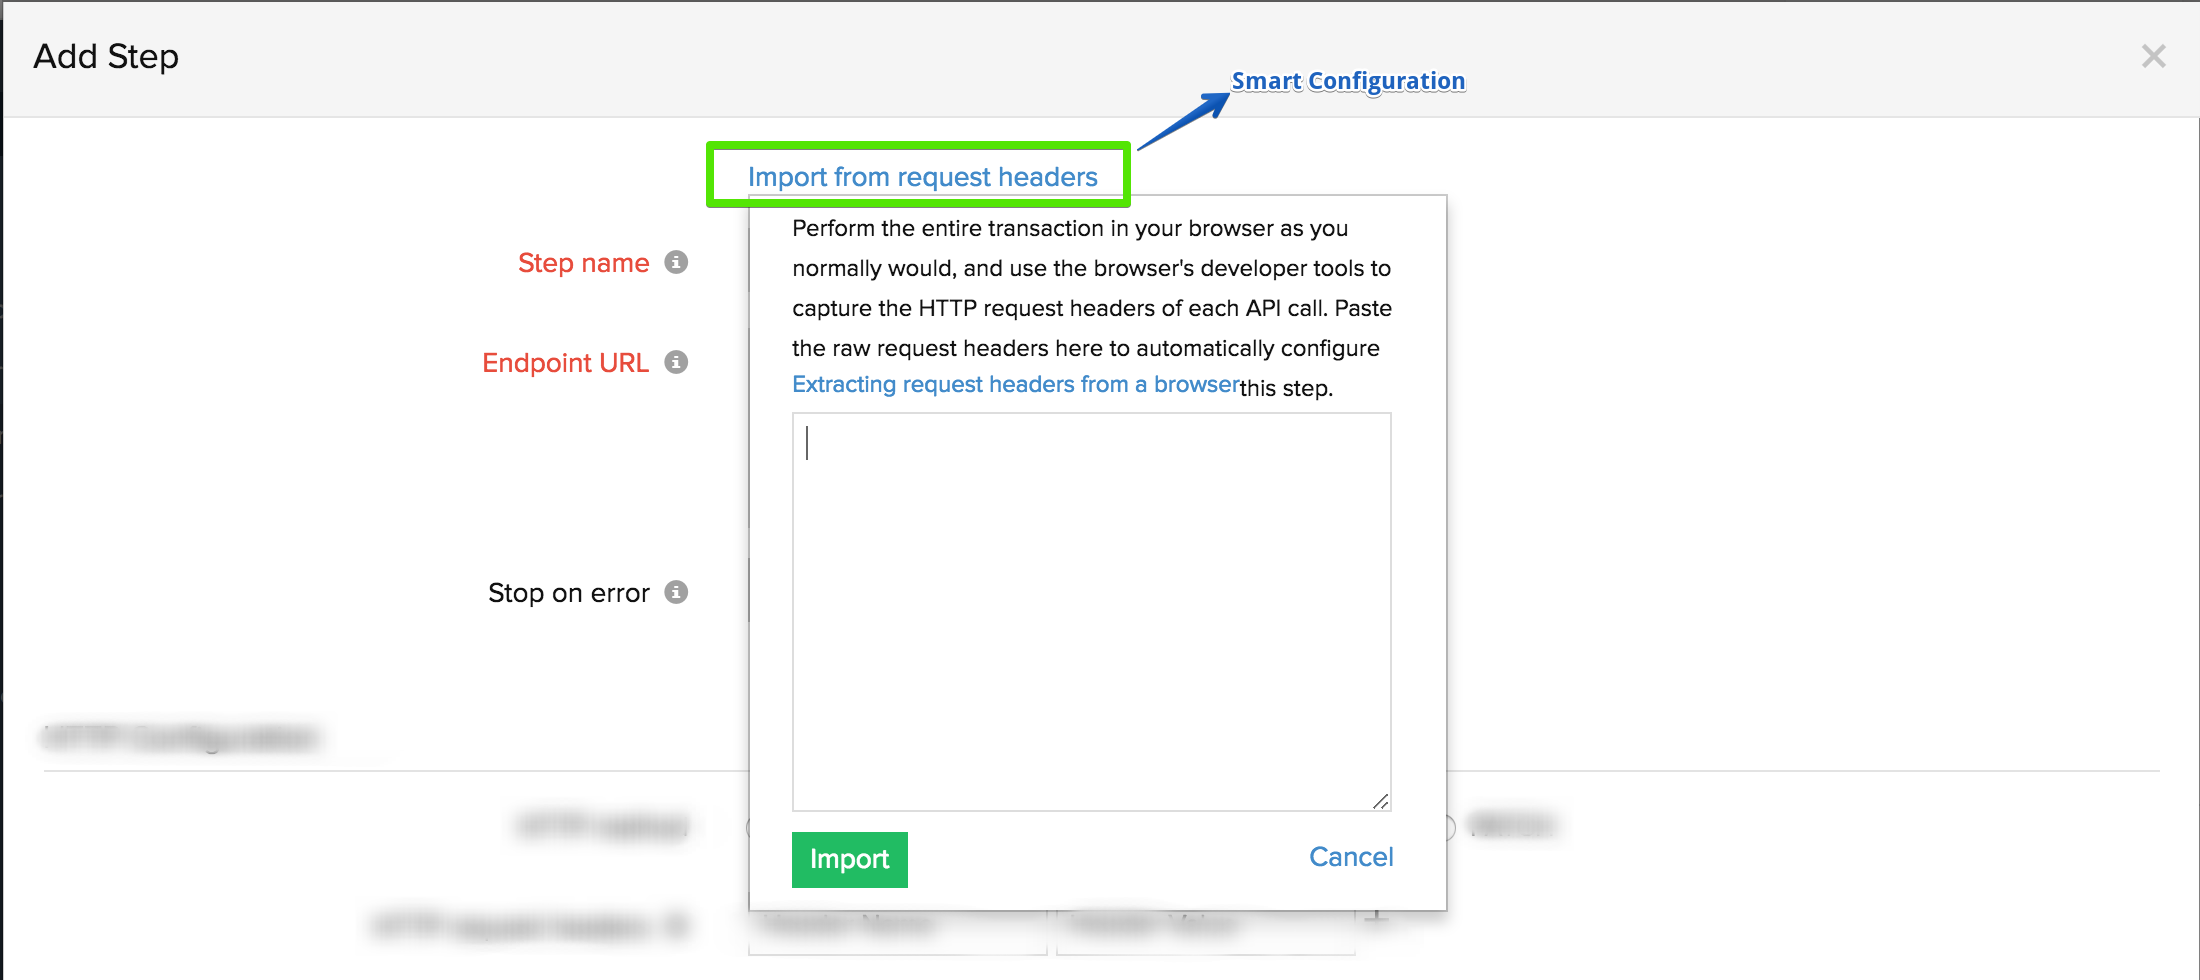
Extract Request Headers using Chrome Developer Tools:
- Launch Chrome browser and access View > Developer > Developer Tools. Click the Network tab and refresh the view to start rendering the network activity. Access a specific activity, go to Headers > Request Headers > View Source. Copy the Request Header.
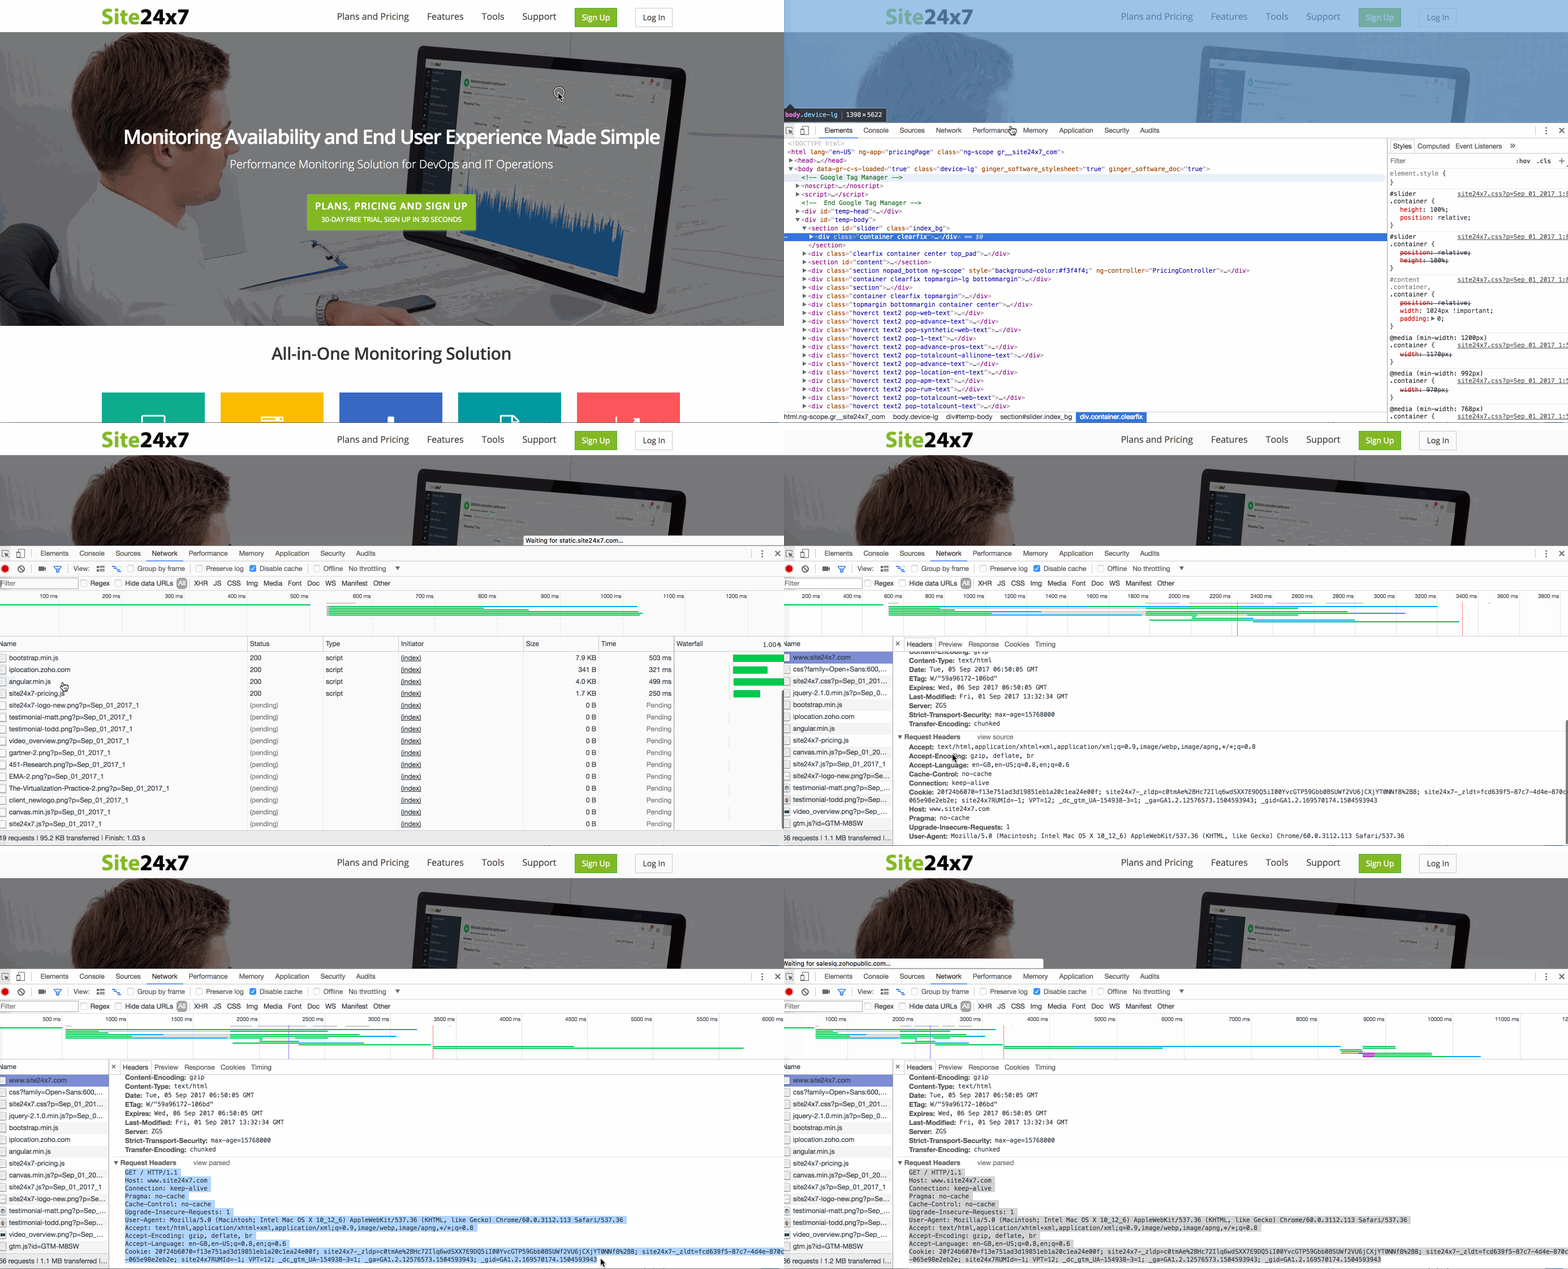
Extract Request Headers using Firefox Network Monitor:
- Launch Firefox browser and navigate to Tools > Web Developer > Inspector. Click the Network tab and refresh the view to render the complete network activity. Now select an activity and double tap the mouse, select Copy Request Headers from the list shown.
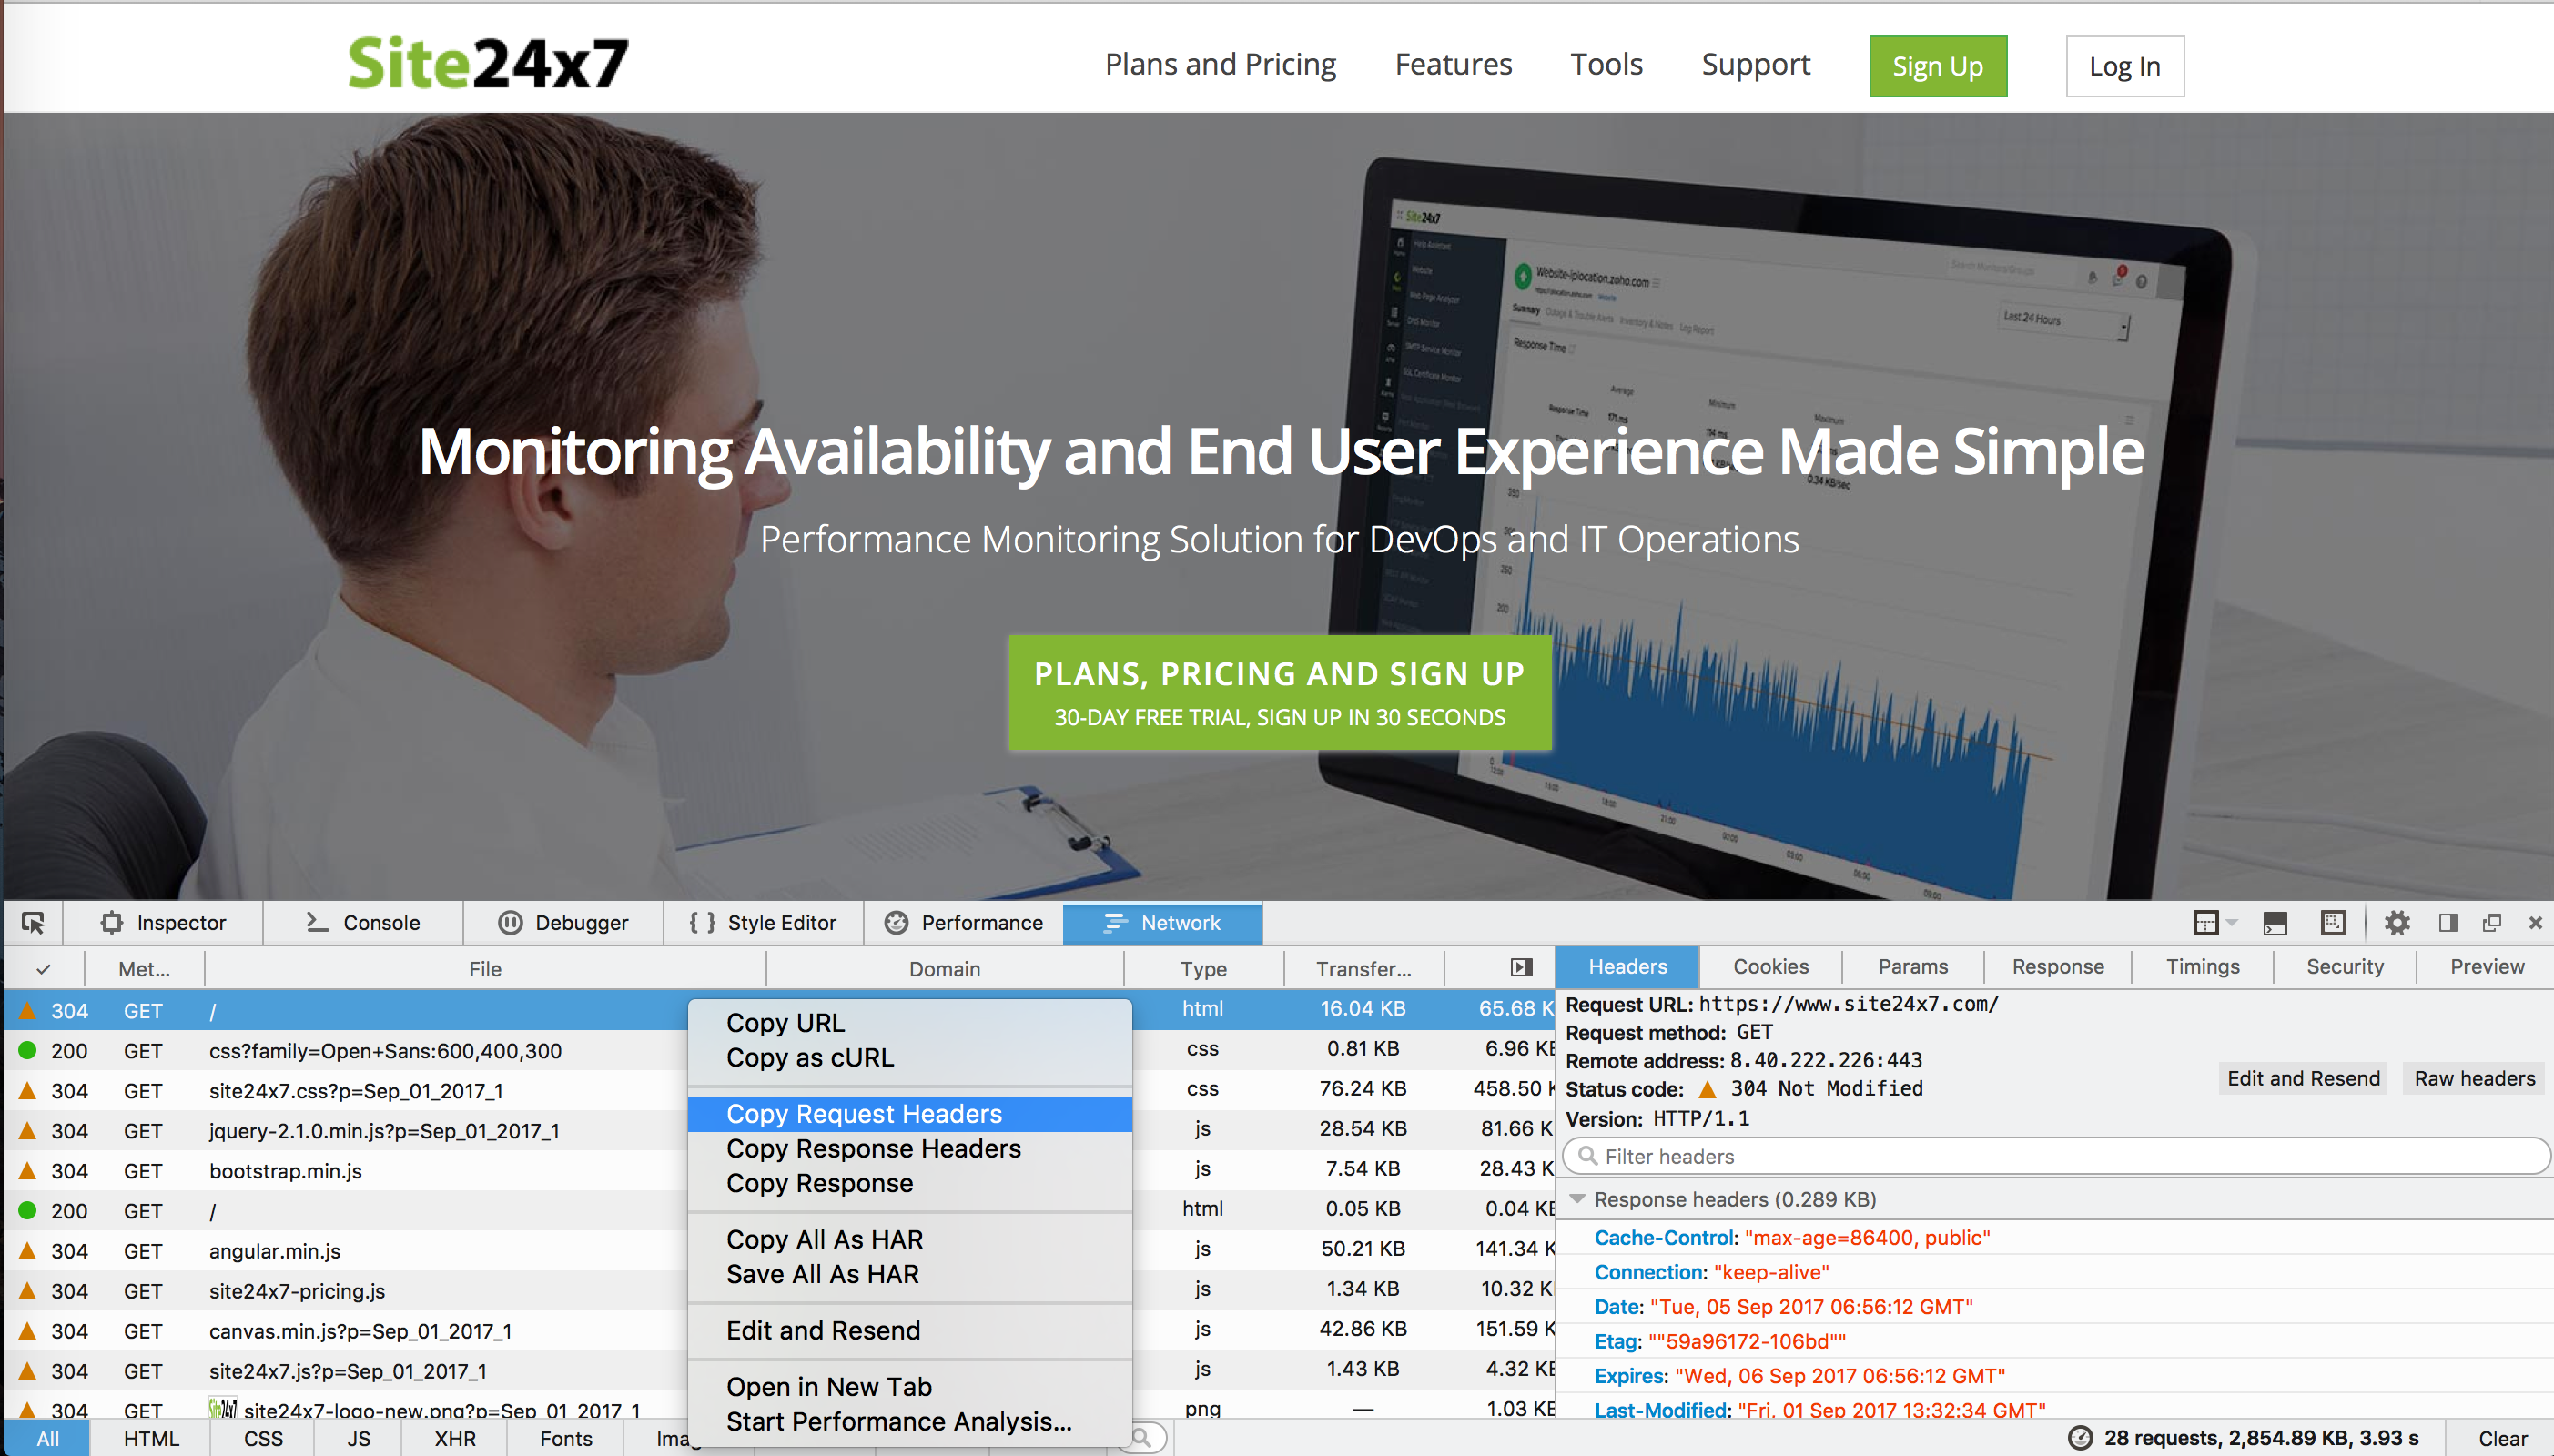
- Once the Request Header is extracted from the browser panel, navigate back to the Site24x7 client and click the link Import from Request headers listedinside the Transaction Step page. Paste the copied Request Header in the text field and click Import. All relevant text fields like Step name, Endpoint URL and other HTTP request headers get auto-populated with this action. You must make sure to remove any unwanted white spaces manually before initiating this import.
HTTP Configuration
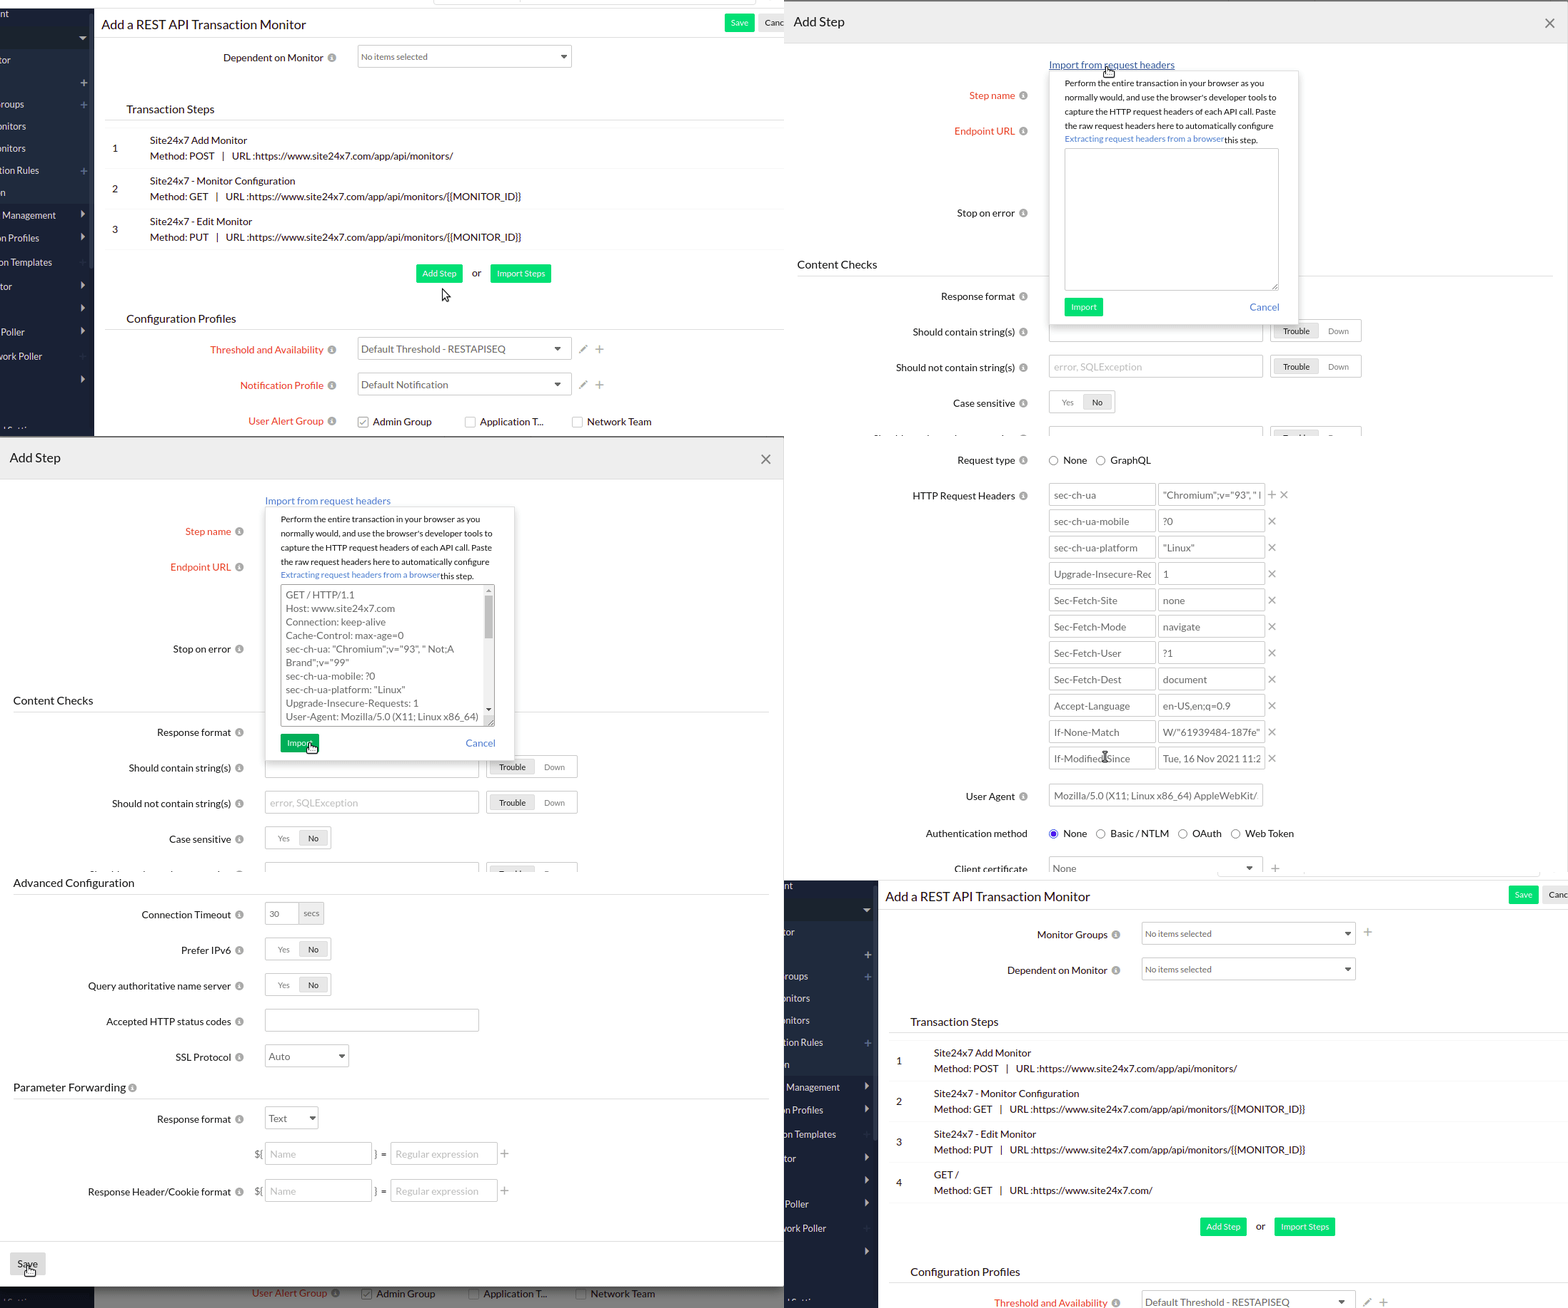
- HTTP Method: Specify the request methods to indicate the desired action to be performed for a given resource. They're HEAD, POST, GET, PUT, DELETE, PATCH, and PROPFIND. Select the appropriate option from the drop-down to configure your form submission method. Also, select the appropriate body type for POST, PUT, PATCH HTTP, and PROPFIND methods.
Monitoring WebDav APIs:
Web Distributed Authoring and Versioning, or WebDAV, is a protocol that allows users to edit, share, copy or move documents through an HTTP web server. The following primary HTTP methods that are used by WebDAV are currently supported in Site24x7:
- PROPFIND
- PROPPATCH
- MKCOL
- COPY
- MOVE
- LOCK
- UNLOCK
By using these methods, you can now perform:
Calendar API monitoring
Calendaring extension to WebDAV, or CalDAV, is an extension of WebDAV that allows users to access or manage calendar-related information on a remote server. It uses the iCalendar format. Using CalDAV, you can synchronize data across devices, retrieve calendar events, schedule new events, set reminders, etc. Examples: Google Calendar and Apple Calendar provide CalDAV access to their services.Contact API monitoring
vCard extension to the WebDAV or CardDav is an address book client or server protocol that allow users to access or share data on a web server. It uses the vCard format for the data. CardDAV helps to retrieve, store, and manage personal contact-related information over a remote server. Examples: Google Contacts and Apple's iCloud Contacts use CardDAV.NotePOST method would submit the parameters to access the URL. POST, PUT and PATCH submission method supports request sending in FORM, Text, XML or JSON formats.
- Request Body: The request body must support embedding parameters of the type ${x} within it. When expanding parameters, they must be escaped appropriately for the selected request body type (Form /Text / XML / JSON).
- Parameter Type: Choose GraphQL if you wish to define the GraphQL query to be sent to the endpoint.
- GraphQL Query:Provide the GraphQL query to obtain the specific fields in response from the GraphQL based API service.
- GraphQL Variables:Specify the values of the variables referred to in the GraphQL query in JSON format.
NoteGraphQL query and GraphQL variables will be included in the request body if you're choosing the POST method. In case of GET method, the GraphQL query and GraphQL variables will be sent through URL Parameters.
- HTTP Request Headers: HTTP Headers are any operating parameters of the transaction. Sometimes you might want to customize the default HTTP request header information. In such cases, the additional header name and header value can be added here.
Note
To use a credential profile in HTTP Configurations, type $ and a list of available credential profiles will appear—select the desired one from this list. Learn more about credential profiles.
- User Agent: Set customized user agent (web browser) for sending your request and the HTTP headers. You can choose from the available user agents.
- Authentication Method: Manage multiple authorization methods for your monitors.
- Basic/NTLM: Configure your Basic/NTLM based authorization. Windows NTLM is the authentication protocol used on systems running on Windows OS.
- Web Credentials: Specify your Username and Password for URLs requiring Basic/NTLM based authentication.
- Kerberos/Negotiation: If you are monitoring a resource secured by Kerberos authentication, select the Kerberos/Negotiation from the drop-down menu.
- Kerberos Authentication: Select the Kerberos credential profile from your preconfigured list or create a new Kerberos authentication profile by clicking the (+) button.
Note- Kerberos authentication is supported only for On-Premise Poller locations.
- Learn how to configure a Kerberos credential profile.
- Kerberos Authentication: Select the Kerberos credential profile from your preconfigured list or create a new Kerberos authentication profile by clicking the (+) button.
- OAuth: Pick the OAuth from the drop-down menu, if you're monitoring a resource that is secured by OAuth framework.
- OAuth Provider Name: Select the OAuth Provider Name from your preconfigured list or create a new OAuth profile by clicking the + button.
NoteLearn how to configure an OAuth Provider.
- OAuth Provider Name: Select the OAuth Provider Name from your preconfigured list or create a new OAuth profile by clicking the + button.
- Web Token:Register Site24x7 with your authentication server to monitor protected APIs using web tokens.
- Web Token Name: Select the Web Token from your preconfigured list or create a new Web Token profile by clicking the + button.
NoteLearn how to add a Web Token.
- Web Token Name: Select the Web Token from your preconfigured list or create a new Web Token profile by clicking the + button.
- AWS Signature: Choose an appropriate Amazon account that is already integrated with Site24x7 from the drop-down. This helps in signing the API request using HMAC to authenticate the API hosted on the AWS API Gateway. Learn how to integrate Amazon account.
Note
Read to learn more about AWS Signature authentication.
- GCP Service Account Key: Select the GCP Service Account Key from the drop-down menu to monitor Google Cloud Project APIs, such as Pub/Sub, that require authentication through Google Cloud's Service Account.
- GCP Service Account: Select the appropriate GCP monitor that has already been added using the GCP Service Account Key JSON file or add a new GCP monitor by clicking the + button and upload the relevant GCP Service Account Key JSON file.
NoteLearn how to configure a GCP Monitor.
- GCP Service Account: Select the appropriate GCP monitor that has already been added using the GCP Service Account Key JSON file or add a new GCP monitor by clicking the + button and upload the relevant GCP Service Account Key JSON file.
- Client Certificate : For transactions that require client certificate authentication, upload the client certificate (has to be a PKCS#12 file.
- Basic/NTLM: Configure your Basic/NTLM based authorization. Windows NTLM is the authentication protocol used on systems running on Windows OS.
Advanced Configuration
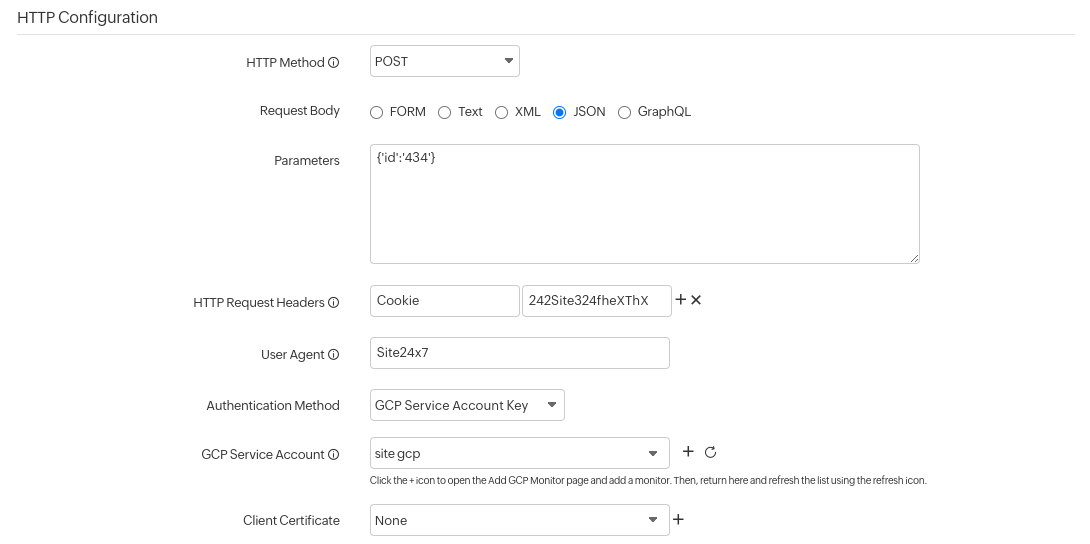
- Connection timeout: Specify the time (in seconds) that the client takes to establish a successful connection with the target server. When this time exceeds, the DNS server will report a "Connection Error".
- Prefer IPv6: If you want to monitor your API endpoints over IPv6 enabled locations, simply move the rocker button to "YES" when creating or editing a monitor form.
Note
- Site24x7 lets you monitor your dual-stacked IPv4/IPv6 based infrastructure as per you need. IPv4 will be enabled as the default protocol. You'll be able to monitor your IPv6 infrastructure, once you enable the rocker button to IPv6. If the connectivity over IPv6 fails, it will not fall back to IPv4 automatically. Read more.
- Enabling IPv6 in the monitoring form doesn't make it compatible to monitor IPv4, by default. If you want to monitor a resource, which is compatible with both IPv4 and IPv6–you'll have to set up two separate monitor checks for this.
- Query Authoritative Name Server: Use the toggle button to decide if you want to resolve your domain name by an authoritative name server.
- Accepted HTTP status codes: Provide a comma-separated list of HTTP status codes that indicate a successful response. You can specify individual status codes, as well as ranges separated with a colon.
- SSL protocol: Specify the version number of the TLS/SSL protocol (TLSv1.2, TLSv1.1, TLSv1, and SSLv3 supported) to validate proper SSL handshake. Use Auto mode to enable automatic detection and negotiation.
NoteSSL Protocol validation works only for HTTPS domains. If you've specified a different SSL protocol version than the actual one, the monitor status fails during the poll.
- HTTP Protocol: Choose the preferred version of the application-layer protocol (HTTP/1.1 or HTTP/2) to be used for negotiation.
- Enable ALPN: Enable ALPN to ensure that only supported application protocols are sent as part of the TLS handshake and ensure reduced round trip time. By default, it'll be set to Yes. Enable ALPN option isn't supported by On-Premise Poller. We'll be extending the support in the next update.
Check Availability
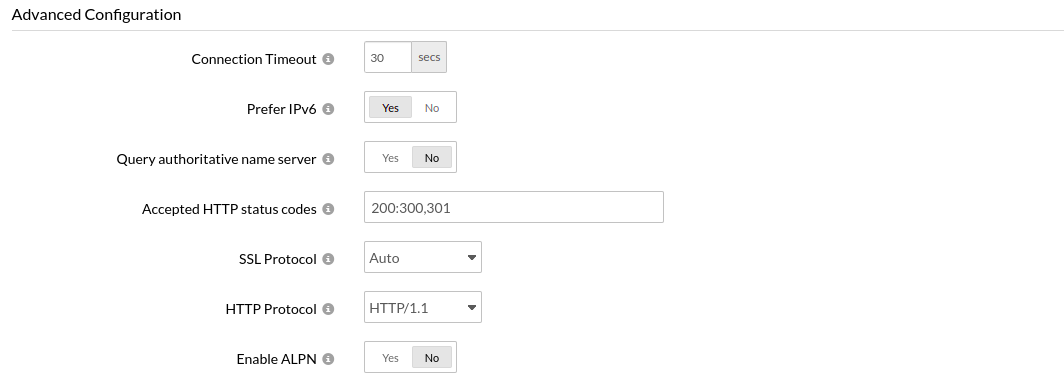
Once you fill in all the mandatory details, you can use the option to test the configurations you've created. Service testing helps you to drill deep into code and get hands-on experience.

You can now choose your preferred action in case of an error. The three options available are:
- Proceed: You can opt to proceed if you do not wish to get notified.
- Notify and Proceed: You can opt to get notified and then proceed with the next action.
- Stop and Notify: By choosing Stop and Notify, you can opt to stop executing the step and get notified of the error.
- Stop and Skip Notify: By choosing Stop and Skip Notify, you can opt to stop executing the step and skip the error notification.
In both these cases, the monitor status will also be changed.

Content Checks:
You can define assertions to validate responses. The expression assertions are evaluated after your request is executed. If any assertion fails, the monitor will throw an outage based on the prescribed settings. For your content checks, you can configure assertions that check response from JSONPath, XML XPath or Regex.
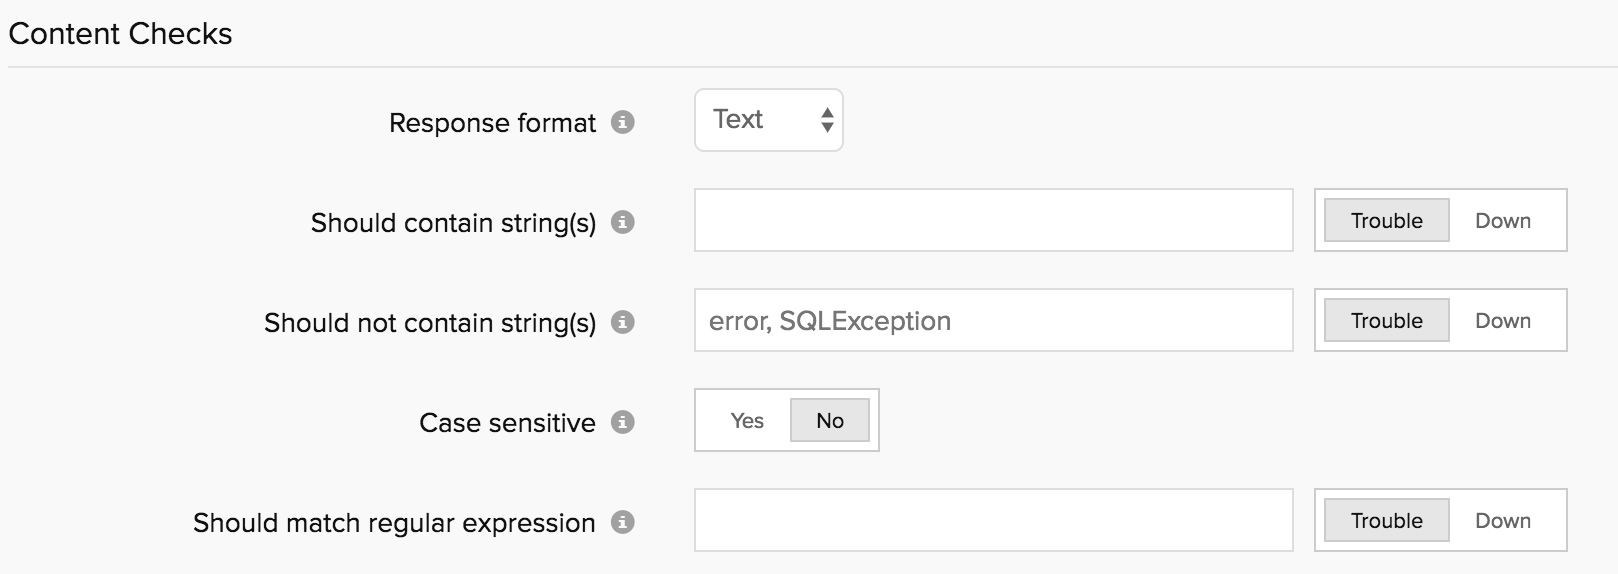
- If the selected Response format is Text
- Should contain string(s): Get alerted when the specified keywords are not present in the response content. Mention the keywords in the check box and use the toggle button to trigger a Trouble or Down alert accordingly.
- Should not contain string(s): Get alerted when the specified keywords are present in the response content. Mention the keywords in the check box and use the toggle button to trigger a Trouble or Down alert accordingly.
NoteYou must implement the following syntax while adding keywords in the given field:
- A single string or keyword can be configured with/without any double quotes (ex: HTML).
- If there are two strings, which comprise a single keyword–add a space in between the two strings and enclose it with double quotes. (ex: "HTML response").
- In case you have more than a couple of individual keywords configured, you will have to separate them with a space and also use double quotes for each of them. ("monitor" "HTML").
- Case sensitive: Enable this option to validate case sensitive text.
- Should match regular expression: Configure your alert based on whether a particular pattern matches with the response content. For example, when you consider the expression ^[a-z0-9_-]{3,15}$, your response content should contain alphabets from a to z, numbers from 0 to 9, underscore and a hyphen. Also there should be a minimum length of 3 characters and maximum length of 15 characters. When it does not match, your API endpoint will be deemed as having an outage and will be reported as "Regular expression"^[a-z0-9_-]{3,15}$" does not match".
Note
Learn more about content checks and negative lookaheads in regular expression match.
- If the selected Response format is XML
- XPath expression: Provide XPath expression to enable the evaluation of XPath expression assertion. The assertion must successfully parse the XPath in the XML to throw a success. You can add multiple XML expression assertions by clicking the "+" key. You can find the XPath in your XML by using the Find my XPath link.
- Alert Severity: Specify the Alert Severity as "DOWN or TROUBLE" to decide the status when the specified XPath expression assertion fails due to a mismatch.

- If the selected Response format is JSON
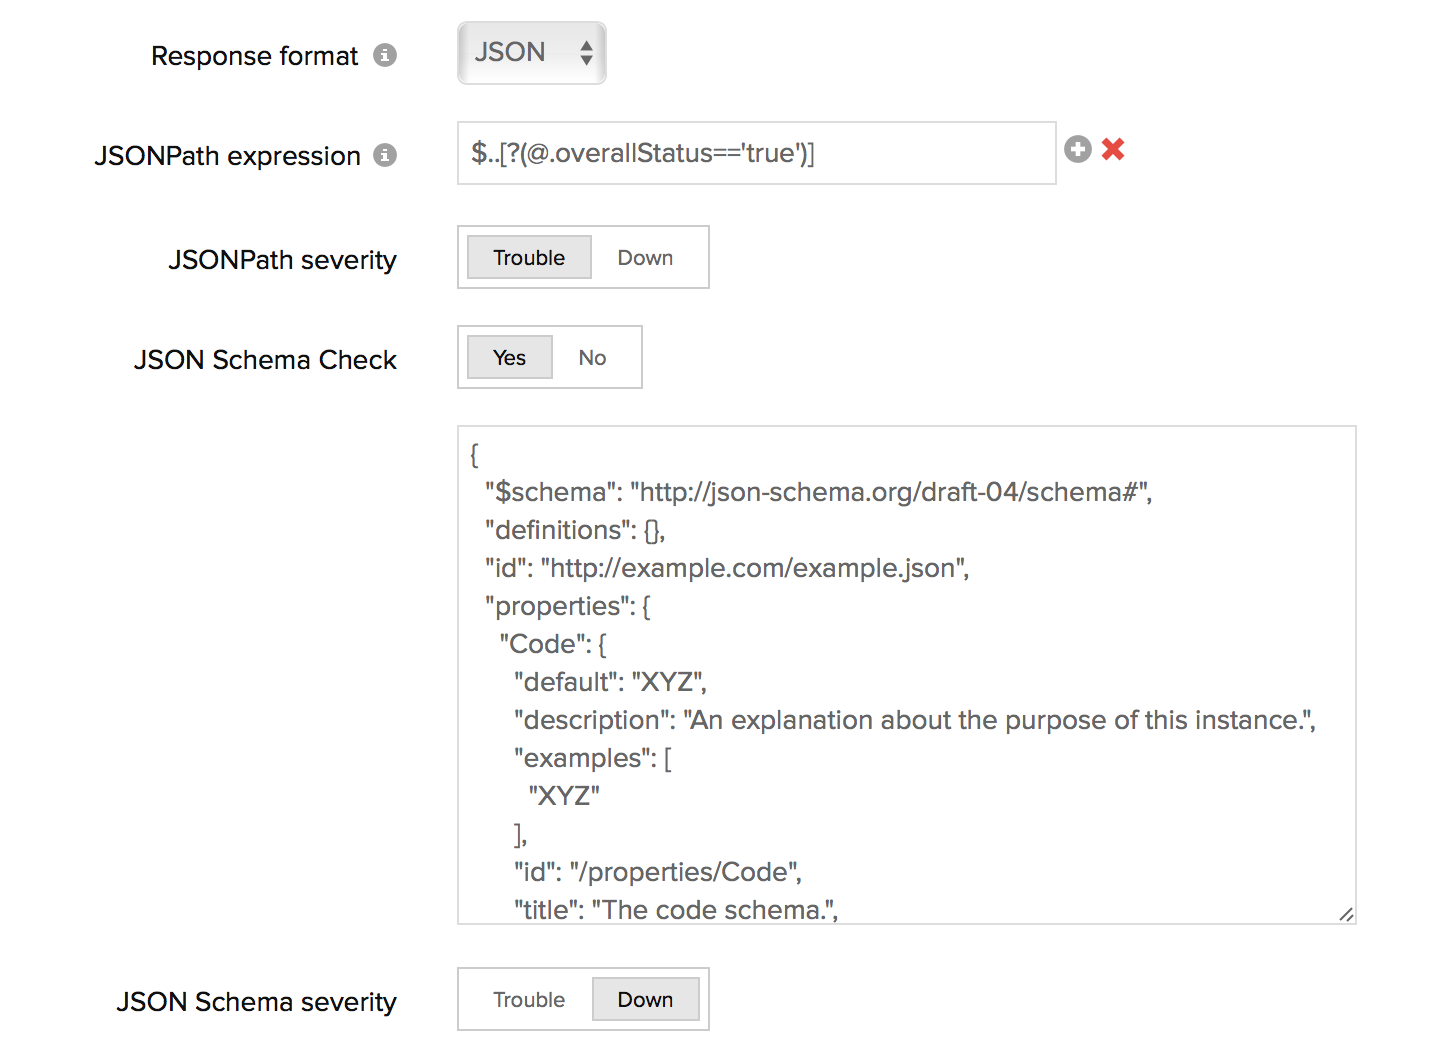
- JSONPath expression: You can specify a JSONPath assertion and test an expected data in the JSON response. For a successful test, the assertion must successfully parse the JSON Path in the JSON. If you need help to build a JSONPath assertion to test against your JSON response, you can our tool for help. You can always add multiple such JSONPATH assertions to test individual use cases. Use the "+" key to add more expression assertions.
Note
Whenever an assertion is processed, the target value in your JSON assertion compares the actual value in the JSON Response to check multiple test scenarios. Common test scenarios that can be checked include:
- Actual value is empty
- Actual value is not empty
- Actual value equals the target value
- Validates that the actual value is greater than or equal to the target value
- Validates that the actual value is less than or equal to the target value
- Actual value contains target value as substring
- Target value is not contained in the actual value
- JSONPath severity: You can specify the Alert Severity as "DOWN or TROUBLE". When the JSONPath assertion fails during a test, an alert will be automatically triggered.
- JSON Schema Check: JSON Schema is a vocabulary that allows you to annotate and validate all JSON endpoints for your web service. To test the HTTP response data against the schema, enable the rocker button to YES and post the JSON schema validation assertion in the text field. In case you've kept the text field empty after selecting the rocker button to YES, the data collection will still occur as usual without any impact on the overall monitor status.
- JSON Schema severity: You can specify the Alert Severity as "DOWN or TROUBLE". When the JSON Schema validation fails during a content check, an alert will be automatically triggered based on your setting.
NoteBelow are the common use cases tested when the API responses are validated against the defined JSON schema:
- Verifying whether values are of a certain type (e.g. integer, string, etc.)
- Ensuring the API JSON responses are structured properly
- Checking for the existence of the required keys in the JSON response
- Test whether an incorrect HTTP response (like an HTML or XML) validates against your given JSON schema.
- Should contain HTTP Response Headers: Enter the desired response header and values for your HTTP request and verify whether the HTTP headers are present or the values match with the desired response. Trigger a trouble or down alert during a check failure.
While configuring the response header check, you must add values based on the following conditions:- You can add multiple headers and each header can accept multiple values.
- A single value can be configured with/without any double quotes (eg.: keep-alive or "keep-alive").
- In case you have multiple header values configured, you will have to separate them with a space and also use double quotes for each of them. (eg., "gzip" "br").
- Header value can also support regex validation. The regex pattern should be "${
}". For example : ${\d{4}} can be used to search for four continuous digit numerical value in the value of the header configured in the header name.
- JSONPath expression: You can specify a JSONPath assertion and test an expected data in the JSON response. For a successful test, the assertion must successfully parse the JSON Path in the JSON. If you need help to build a JSONPath assertion to test against your JSON response, you can our tool for help. You can always add multiple such JSONPATH assertions to test individual use cases. Use the "+" key to add more expression assertions.
- HTTP Response Header Severity : Use the toggle button to specify the Alert Severity as DOWN or TROUBLE. When the test fails an alert will be automatically triggered.

Parameter Forwarding
You can use parameter forwarding as a feature to pass data and test data validation between chained requests. Individual values from responses can be extracted using XPath, JSONPath, or Regular expressions and can be saved as custom parameters. Also, values can be extracted from headers using a regular expression. These parameters can then be used to build custom query strings or POST data for subsequent steps. Based on your selection of Text, XML or JSON based response data format, you can build custom Regex based expressions, XPath expressions, or JSONPath based expression assertions. When you invoke the ${Parameter} in the HTTP requests of your successive steps, the output value of the invoked expression assertion will be used in these steps for various step validation use cases.
Import Test Cases: Swagger 2.0 / OpenAPI Definition in JSON/YAML
Swagger 2.0 / OpenAPI format offers numerous supporting tools for API documentation and quick-start server implementations. You can export your Swagger defined APIs in JSON/YAML and use it to create automated test scenarios in Site24x7. By importing the Swagger defined JSON/YAML file, you can save a lot of time and manual work of entering every method from your API, instead customize your REST API Transaction monitor in a matter of minutes. When you import a Swagger definition in JSON/YAML, individual transactions are created for every method you’ve defined, automatically and with just a few clicks. Site24x7 reads the structure of the API as you’ve defined in Swagger along with all of its step names, headers, endpoint URLs, etc., handling much of the initial heavy lifting for you around setting up your steps. Import Swagger definitions by following the the steps below:
- Login to Site24x7 > Admin > Add a Monitor > REST API Transaction
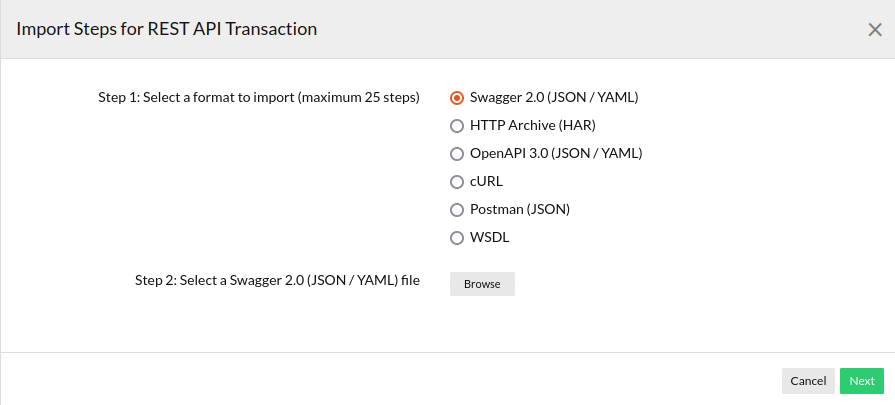
- Click the Import button under Transaction Steps. You'll be prompted with an Import Steps pop-up window.
- Select the Swagger 2.0 (JSON/YAML) or OpenAPI 3.0 (JSON/YAML) radio button and browse the Swagger 2.0 / OpenAPI 3.0 (JSON/YAML) file from your local machine. Once done, click Next.
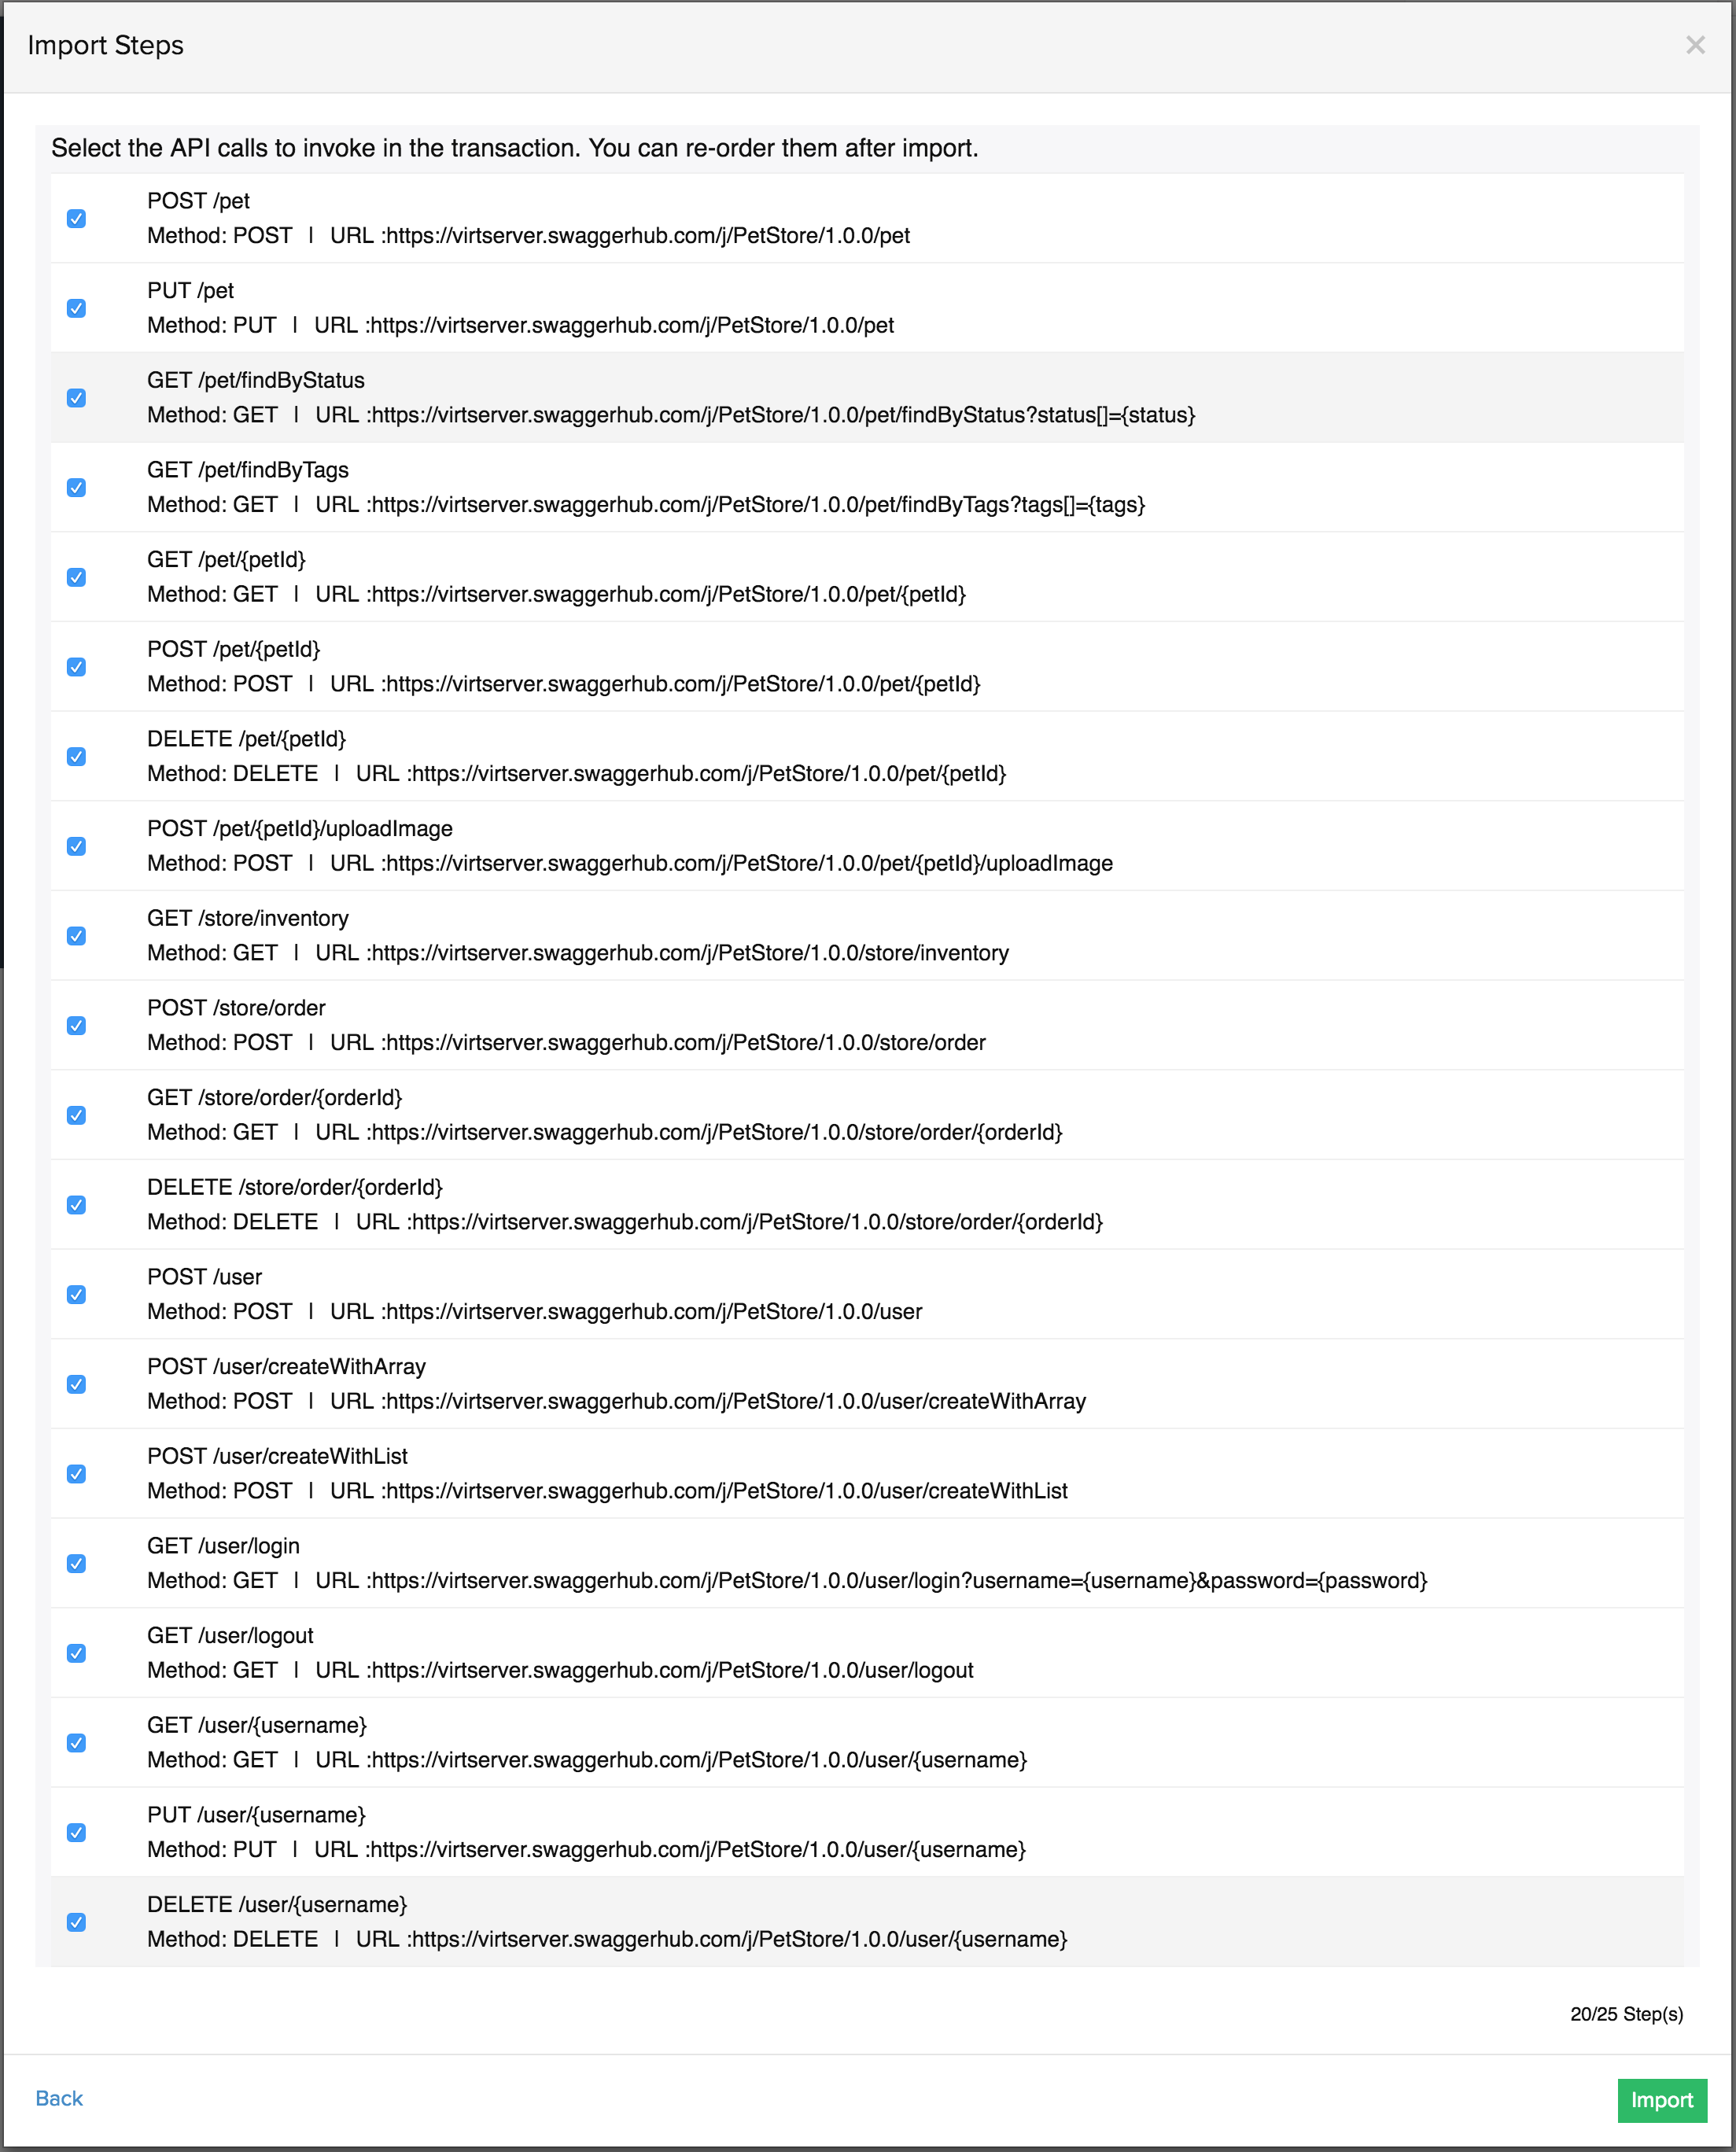
Select all API calls that you wish to import into Site24x7 for monitoring and click Import. You can always re-order the steps after import.
You can only pick 60 API transactions to create your monitor. Endpoint URL and HTTP Headers and body will be automatically defined for individual transactions. However, you must make sure you fine-tune all the Headers and body with the correct values. Else, the monitor will go under configuration error.
Import Test Cases: HTTP Archive (HAR) Format
You can import your downloaded HTTP Archive (HAR) file to create test scenarios in Site24x7. A HAR file for your transaction can be extracted using your browser's developer tools. Like with Swagger, all the step names, headers, endpoint URLs, etc., will be extracted from the HAR file and it helps expedite the entire monitor configuration process by auto-filling all the available parameters and values for each steps. Once you download the HAR file, follow the steps below to set-up your monitor in Site24x7:
- Login to Site24x7 > Admin > Add a Monitor > REST API Transaction
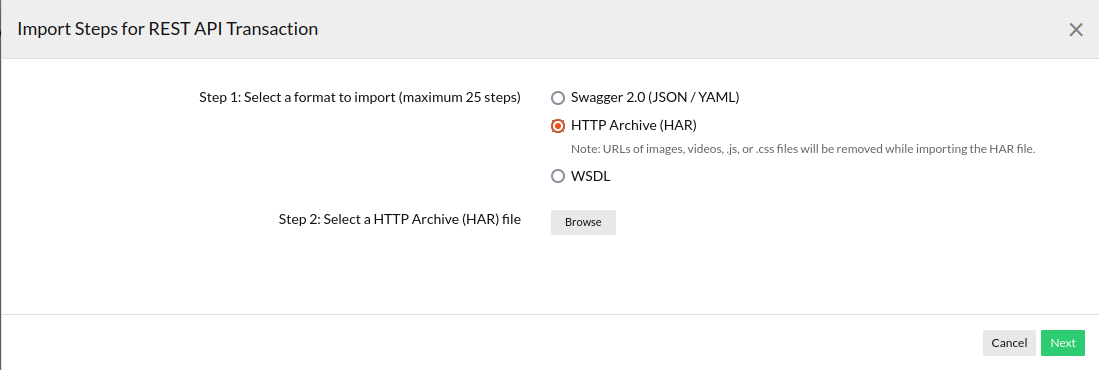
- Click the Import button under Transaction Steps. You'll be prompted with an Import Steps popup window.
- Now choose the HTTP Archive (HAR) radio button and browse the HAR file from your local machine. Once done, click Next.
Select all API calls that you wish to import into Site24x7 for monitoring and click Import. Once imported, you can always re-order them as per your requirements.
You can only pick upto 60 API calls to configure your monitor.
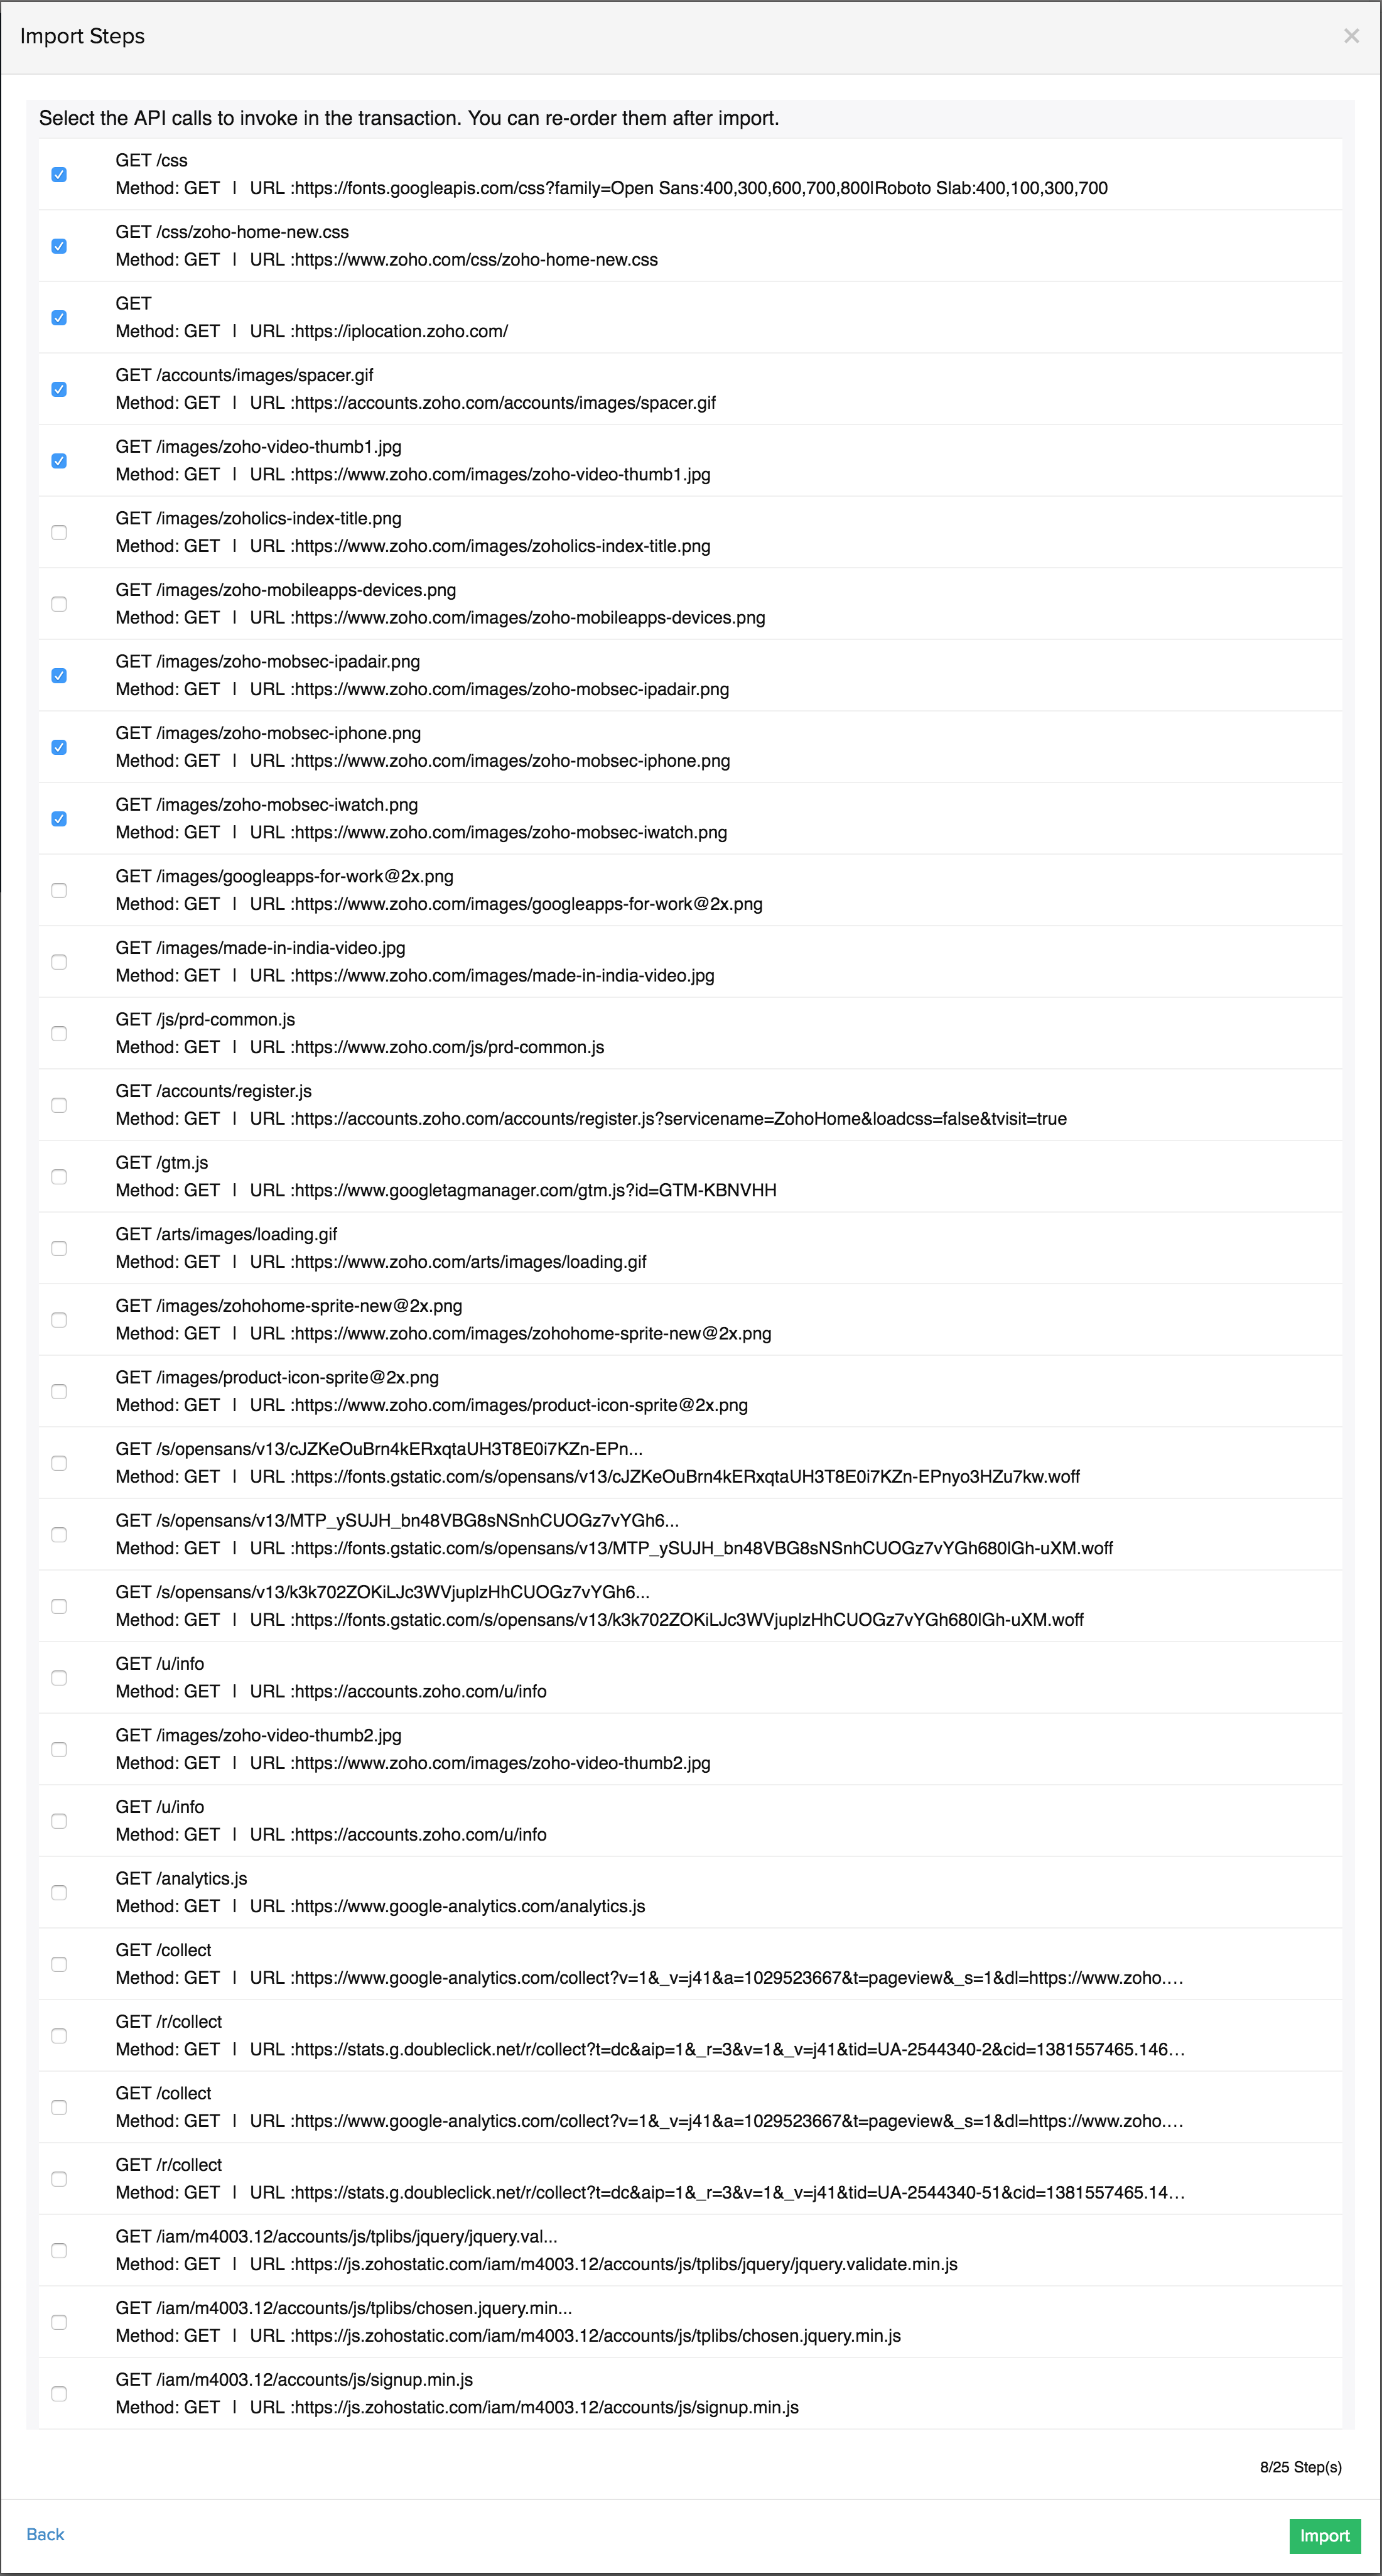
Once you opt to import the steps by clicking the Import button, Parameter Forwarding, JSON response check for POST and PUT methods in the JSONPath expression, and JSON Schema Check will be performed automatically based on the request and response in the given HAR file.
Import Test Cases: WSDL Format
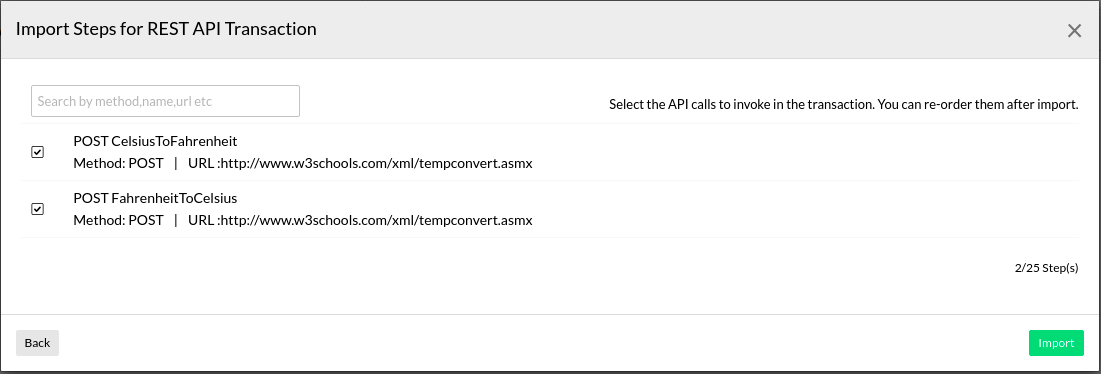
Providing Web Services Description Language (WSDL) URL as an input can help you perform all supported operations easily. It generates a request XML, Endpoint URL, and required request headers for the selected operation which is importing the steps.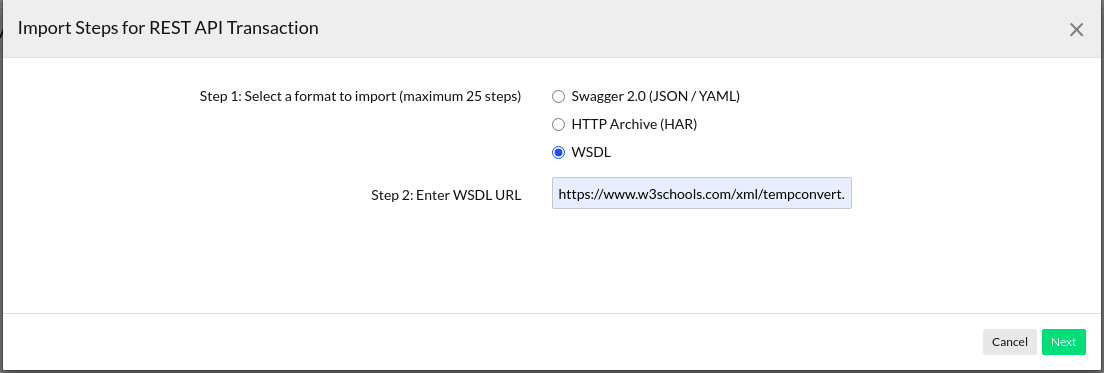 Define the following details to successfully undertake the test operation:
-
- Enter WSDL URL:Type the WSDL URL which requires to be monitored.
- Click Next.
Import Test Cases: cURL Format
A cURL file for your transaction can be extracted using your browser's developer tools. The extracted cURL steps should be uploaded in a file with .curl extension. You can import your downloaded cURL file to create test scenarios in Site24x7. Like with Swagger, all the step names, headers, endpoint URLs, etc., will be extracted from the cURL file. This helps expedite the entire monitor configuration process by auto-filling all the available parameters and values for each steps. Only POST, PUT, DELETE, and GET operations will be supported.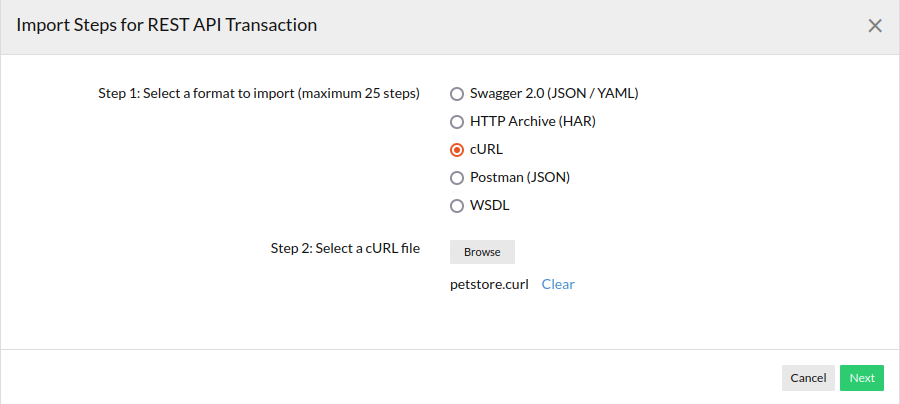 Once you download the cURL file, follow the steps below to set-up your monitor in Site24x7:
- In the Site24x7 web client, navigate to Admin > Add a Monitor > REST API Transaction.
- Click the Import button under Transaction Steps. You'll be prompted with an Import Steps pop-up window.
- Now, choose the cURL radio button and browse the cURL file from your local machine.
- Once done, click Next.
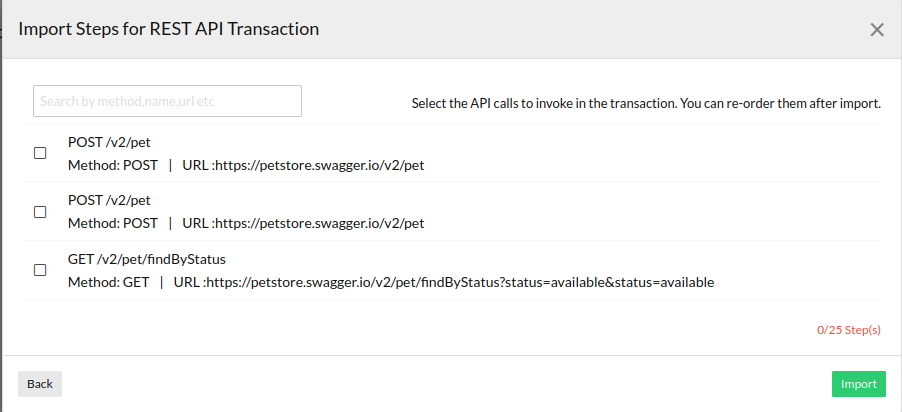
Import Test Cases: Postman JSON
Postman Collection is a group of API requests that can be shared with your team or exported. You can export your collections from Postman and use it to create test scenarios in Site24x7. You can import your downloaded Postman (JSON) file to Site24x7. Like with Swagger, all the step names, headers, endpoint URLs, etc., will be extracted from the Postman (JSON) file. This helps expedite the entire monitor configuration process by auto-filling all the available parameters and values for each steps. Only POST, PUT, DELETE, and GET operations will be supported.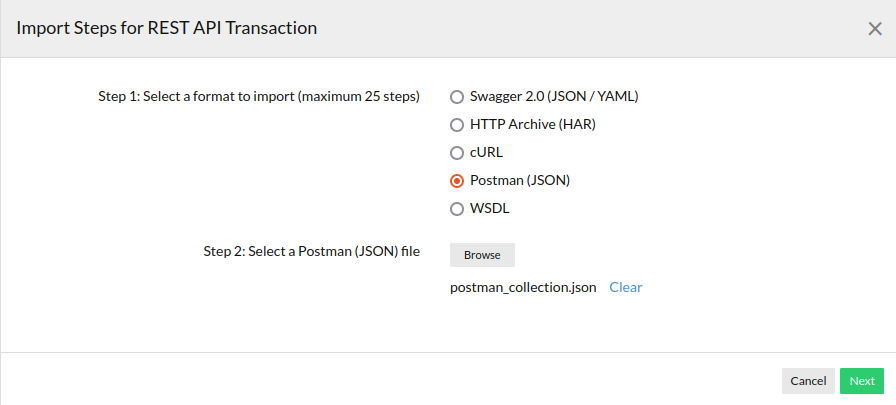 Once you download the Postman(JSON) file, follow the steps below to set up your monitor in Site24x7:
- In the Site24x7 web client, navigate to Admin > Add a Monitor > REST API Transaction.
- Click the Import button under Transaction Steps. You'll be prompted with an Import Steps pop-up window.
- Now, choose the Postman (JSON) radio button and browse the Postman (JSON) file from your local machine.
- Once done, click Next.
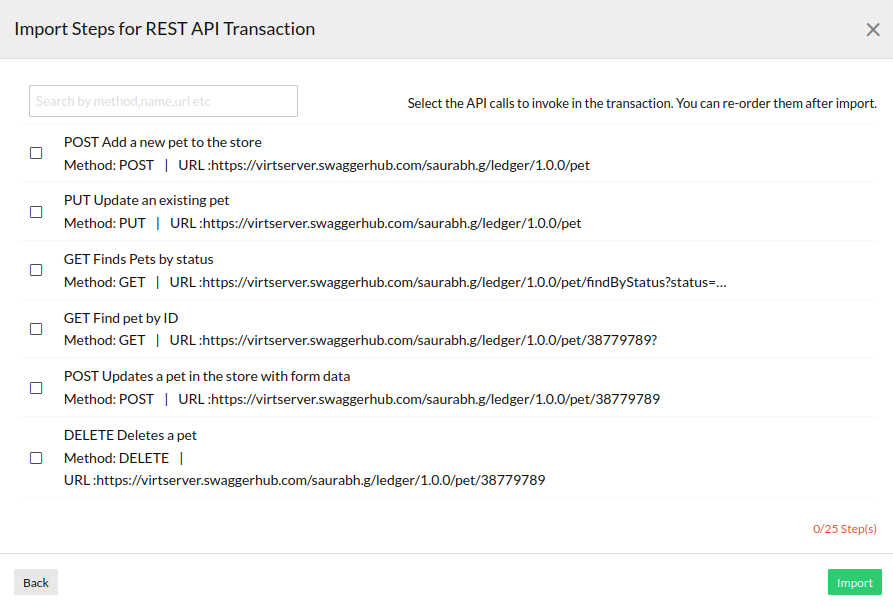
Import test cases: Hoppscotch JSON
Hoppscotch is a development tool used to test and develop APIs. You can export your collections from Hoppscotch and utilize them to create test scenarios in Site24x7. You can import your downloaded Hoppscotch (JSON) file to Site24x7. Clicking Next will display all the step names, headers, endpoint URLs, etc. This will extract the Hoppscotch (JSON) file, which helps expedite the entire monitor configuration process by auto-filling all the available parameters and values for each step.
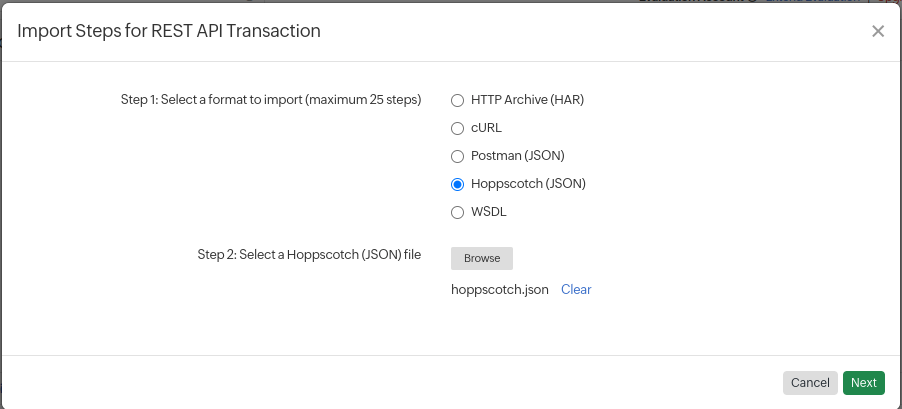
Download the Hoppscotch (JSON) file and follow the below steps to set up a monitor in Site24x7:
- In the Site24x7 web client, navigate to Admin > Add a Monitor > REST API Transaction.
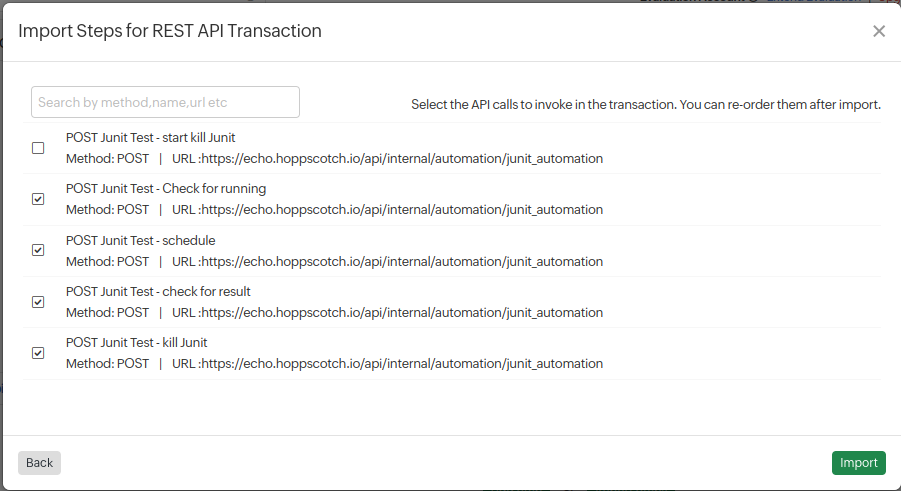
- Clicking the Import button under Transaction Steps will display a pop-up window titled Import Steps for REST API Transaction.
- Now, choose the Hoppscotch (JSON) radio button and browse for the Hoppscotch (JSON) file from your local machine.
- When the JSON file is uploaded, click Next.
- A list of methods from the JSON file will be listed. Select the methods you would like to import.
- Click Import to import the JSON methods to your REST API Transaction monitor.
Configuration Profiles
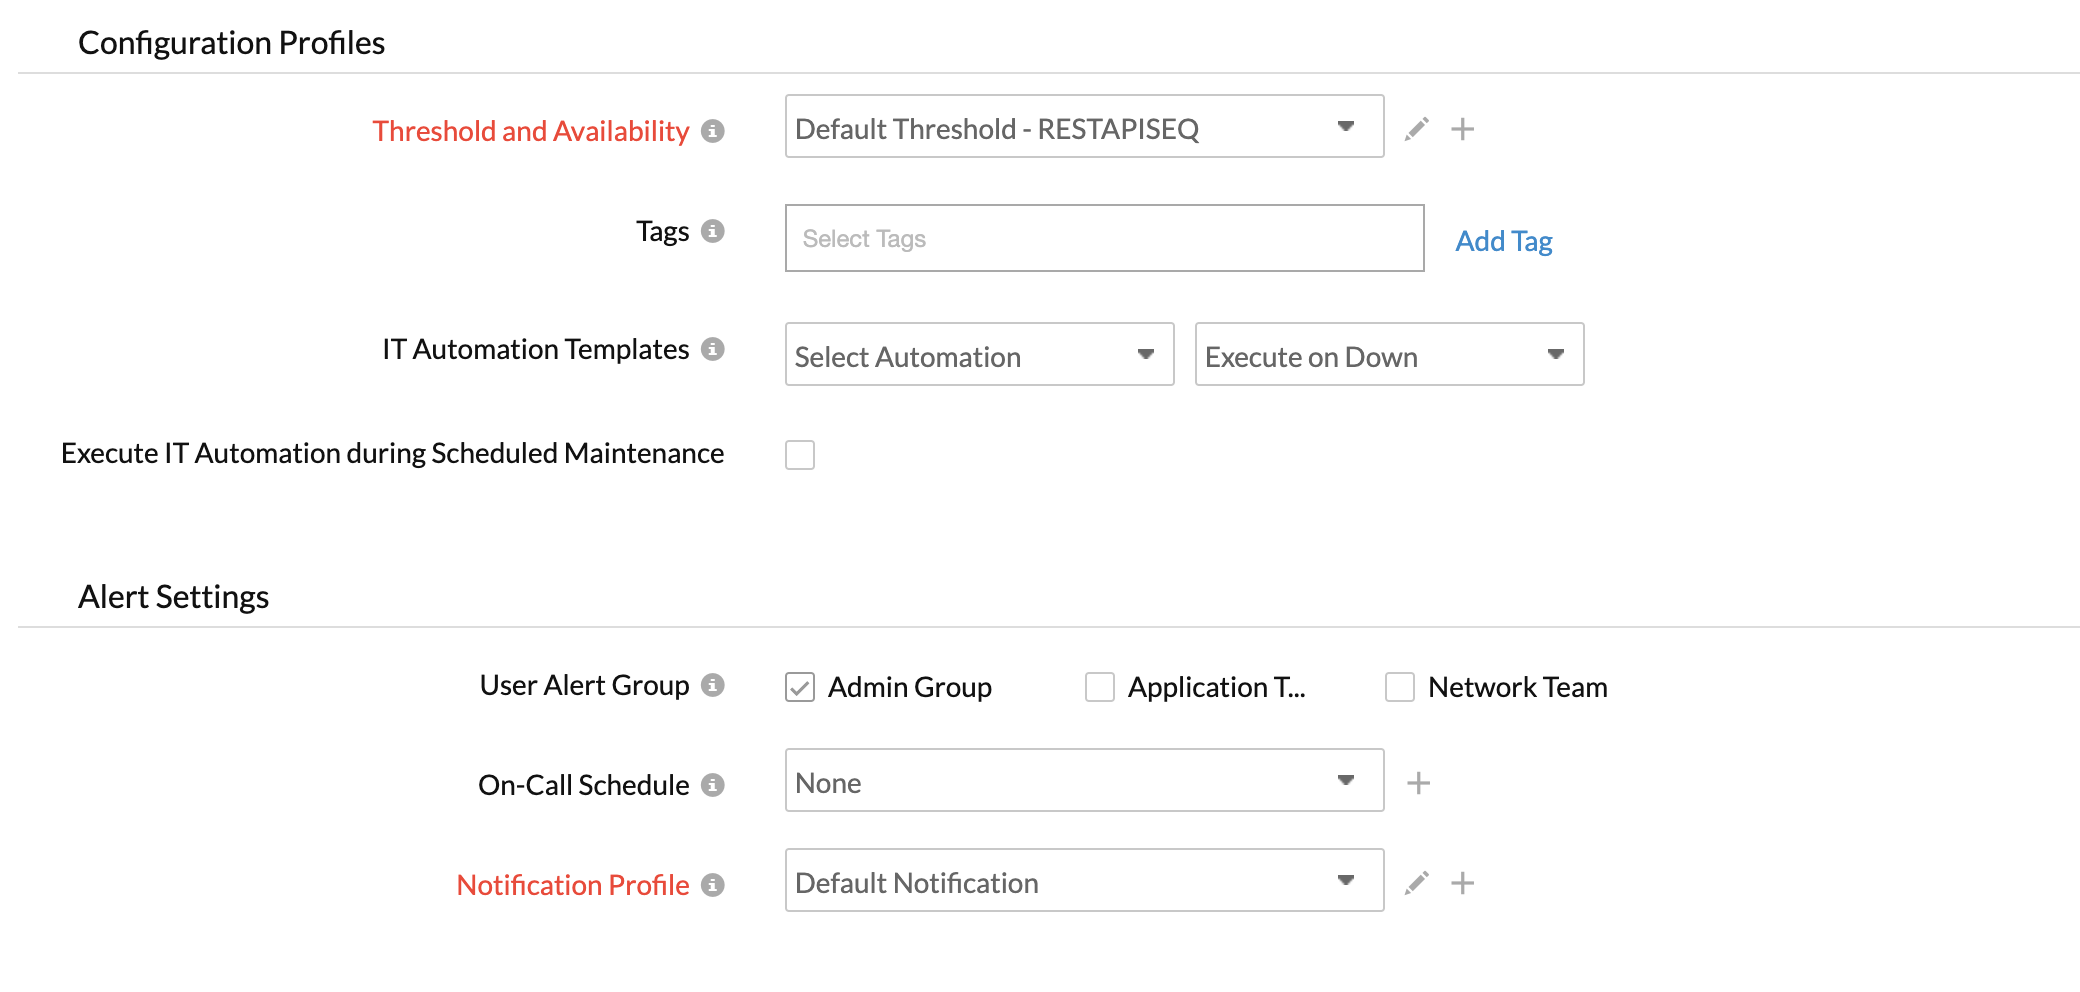
Threshold and Availability: Select a threshold profile from the drop down list or choose the default threshold available and get notified when the resource crosses the configured threshold.
To create a customized threshold and availability profile, refer Threshold and Availability. You can even execute automations once your defined threshold is breached. Learn more about Automations.
Tags: Associate your monitor with predefined Tag(s) to help organize and manage your monitors creatively. Learn how to add Tags.
IT Automation: Select an automation to be executed when the website is down/trouble/up/any status change/any attribute change. The defined action gets executed when there is a state change and selected user groups are alerted.
To automate corrective actions on failure, refer IT Automation.
Alert Settings
User Alert Group: Select the user group that need to be alerted during an outage. To add multiple users in a User Alert Group, see User Alert Group.
On-Call Schedule: The On-Call Schedule option helps you to ensure that the notifications are sent to assignees in specific shift hours helping them to quickly respond to alerts or incidents. Choose an On-Call of your preference from the drop-down.
Notification Profile: Choose a notification profile from the drop down or select the default profile available. Notification profile helps to configure when and who needs to be notified in case of a DOWNTIME. Refer Notification Profile to create a custom notification profile.
You can receive alerts if the monitors are associated to user groups irrespective of the On-Call shift you've configured.
Third-Party Integration
Associate your monitor with a pre-configured third-party service. It lets you push your monitor alarms and incidents to selected services and facilitate improved incident management and collaboration.
If you haven't setup any integrations yet, navigate across to ”Admin > Third-Party Integration” to create one. Tell me more about Third-Party Integration.
Click Save to complete your monitor setup. You can click Check and Save if you want to run the configurations and seewhether the monitor is performing well and then get the monitor saved. In case of an error, the monitor will not be saved.
Possible Use Cases
REST API Transaction Monitor allows you to capture the transaction to fetch the token from the Auth service, pass the token to other services as part of the same monitor. In addition, these are some possible use cases where the REST API Transaction monitor can be actively employed to ensure end-to-end availability of your website or modern web/mobile application:
Monitoring chained API Transactions:
In a web application, where API endpoints are interlinked, data is passed from one request to another. The entire response, or a part of it, can be recorded as a response parameter and resused in successive steps to complete the transaction. Let's take the below use case. The GET Monitor Status API gives a JSON response of all your monitors in your Site24x7 account. You can use the below URL to fetch the below JSON response for your account. Step 1 can be the transaction step 1 in your REST Transaction Monitor.
Step URL 1: https://site24x7.com/api/current_status/type/RESTAPISEQ?authtoken=95c883409340sdsds4qqwr47dsdsd461beb7ea6b
{
"code": 0,
"message": "success",
"data": {
"monitors": [
{
"outage_id": "1500384436349",
"name": "JSON Check",
"downtime_millis": "3424304",
"down_reason": "Trouble invoking url (Step Url Name) in JSON Check.\nUnable to connect to https://www.site24x7.com${test}.",
"duration": "57 Mins 4 Secs",
"attribute_key": "transaction_time",
"status": 0,
"attributes": [
{
"attribute_label": "web.application.details.transaction.time",
"unit": "ms",
"attribute_key": "rsptime",
"attribute_value": 2124
}
],
"last_polled_time": "2017-07-18T18:51:10+0530",
"attributeName": "TRANSACTIONTIME",
"monitor_type": "RESTAPISEQ",
"attribute_label": "Transaction Time",
"unit": "ms",
"monitor_id": "6000000120027"
},
{
"name": "wewewewewew",
"status": 10,
"attributes": [
{
"attribute_label": "web.application.details.transaction.time",
"attribute_key": "rsptime",
"attribute_value": "-"
}
],
"last_polled_time": "2017-06-28T15:08:20+0530",
"attributeName": "TRANSACTIONTIME",
"monitor_type": "RESTAPISEQ",
"monitor_id": "6000000064003"
}
]
}
}
JSONPath expression assertion for the above JSON data: test=$.data.monitors[?(@.status==0)].monitor_id
In the transaction step 1, you can now specify a JSONPath expression assertion using the above JSON response as the primary input. Similarly, you can build a Regex expression or XPath expression based on the input. The JSONPath expression in our example can be used to query all monitor_id with DOWN status (status '0' is DOWN).
Step 2 URL: https://site24x7.com/api/reports/outage/${test}?period=1&authtoken=95c883409340sdsds4qqwr47dsdsd461beb7ea6b
Build the step URL 2 using the customized parameter expression that you've created above. This is also known as parameter forwarding. Step 2 URL here can be used to fetch outage reports for all DOWN monitors. Here we use the custom parameter value fetched from Step 1's URL response as the input for Step 2 URL. If the URL executes successfully, you will get an outage report for the DOWN monitor in this step. This will also render the status of the REST Transaction Monitor as UP. However, if the expression assertion doesn't render any response , the step 2 will fail and put the overall monitor status as DOWN. This chaining can continue as long as the user wishes and the API supports it.
{
"code": 0,
"message": "success",
"data": {
"outage_details": [
{
"display_name": "JSON Check",
"outages": [
{
"outage_id": "1500384436349",
"end_time": "2017-07-18T20:12:33+0530",
"type": 0,
"start_time": "2017-07-18T18:57:16+0530",
"reason": "Trouble invoking url (Step Url Name) in JSON Check.\nUnable to connect to https://www.site24x7.com${test}.",
"duration": "1 Hrs 15 Mins "
},
{
"outage_id": "1500383206387",
"end_time": "2017-07-18T18:46:05+0530",
"type": 0,
"start_time": "2017-07-18T18:36:46+0530",
"reason": "Trouble invoking url (Step Url Name) in JSON Check.\nUnable to connect to https://www.site24x7.com/${test}.",
"duration": "9 Mins 18 Secs"
}
],
"monitor_id": "6000000120027"
}
],
"info": {
"resource_name": "JSON Check",
"end_time": "2017-07-18T20:12:33+0530",
"resource_type_name": "Monitor",
"report_name": "Outage Report",
"period_name": "Last 24 Hours",
"formatted_start_time": "17 July 2017 20:12 IST",
"generated_time": "2017-07-18T20:12:33+0530",
"formatted_end_time": "18 July 2017 20:12 IST",
"start_time": "2017-07-17T20:12:33+0530",
"resource_type": 2,
"period": 1,
"formatted_generated_time": "18 July 2017 20:12 IST",
"resource_id": "6000000120027",
"report_type": 12
}
}
}
Monitoring a modern web application with a combination of HTML and REST API calls:
All modern web applications and mobile apps predominantly use REST APIs to execute the application actions. In-between HTML pages are also used to facilitate processes like sign up, login, text submission etc. REST API Transaction monitor lets you build and test this interlinked workflow. You've to configure all your API endpoints and website URLs under individual transaction steps, so as to enable Site24x7 to monitor the entire transaction end-to-end.
Note
Read more about Site24x7 Rest API monitoring tool.
-
On this page
- Key Facets of the Dynamic UI
- Configuring REST API Transaction Monitor
- General Settings
- Add New Transaction Step(s)
- Smart Configuration
- HTTP Configuration
- Advanced Configuration
- Check Availability
- On Error
- Content Checks
- Parameter Forwarding
- Import Test Cases: Swagger 2.0 / OpenAPI definition in JSON/YAML
- Import Test Cases: HTTP Archive (HAR) Format
- Import Test Cases: WSDL Format
- Import Test Cases: cURL Format
- Import Test Cases: Postman (JSON) Format
- Import test cases: Hoppscotch JSON
- Configuration Profiles
- Alert Settings
- Third-Party Integration
- Possible Use Cases
- Interpret Performance Metrics
- Related Monitors
- Compare Monitor Features
