Monitor Groups
Monitor Group is a handy concept that enables you to seamlessly organize your monitored resources and ease administration. It lets you organize resources (Monitors) by business application, geography, type, resource ownership, and more. Let's say you've a web application that uses certain databases, application servers, and physical servers for hosting the service. Now with the "Monitor Group" concept, you can quickly assemble all these resources under a single bracket and thus, facilitate in general reporting and also help gain insight into the real-time and historical operational trends of individual resources and group during an outage. Additionally, you can also add nested Subgroups upto level five under a main monitor group and thus, visualize all your monitoring resources using a Business View. Business View clearly serves the purpose of representing the status of a "Business Application" in this context.
Adding Monitor Group
Monitor Groups and Subgroups help you seamlessly organize your monitored resources and ease administration. Once a Monitor Group is configured, the associated Business View is automatically generated, which then offers a visual representation of the various connections and dependencies of these groups and its multiple subgroups. Monitor Groups are created when:
- System generated Groups are created after deep discovery of Internet resource monitors
- Using Default Templates to create a Business View framework
- Manual Configuration
System Generated Groups
Deep Discovery for Internet Services lets you intelligently discover all the internet resources behind your hosted domains. During deep discovery, Site24x7 auto-discovers and suggests all probable internet service monitors for that specific domain/sub-domains with the help of an intuitive wizard. Once these monitors are configured, Site24x7 will automatically setup a Monitor Group with these monitors alone. You can achieve further customization by adding Subgroups and associating relevant monitors to it.
Using Default Templates
The easiest way to configure any Monitor Group is by using default templates offered by Site24x7. You can pick a predefined Business View template provided by Site24x7 to create a Monitor group with relevant subgroups. Once an empty Monitor group is created, you can instantly customize different groups and subgroups by associating more monitors to each of these groups. It let's you view a personalized Business View of your resources, in a matter of minutes. The templates available are:
- Website/Port/DNS
- Application Server
- AWS Infrastructure
- Network
- Website/Server
- Log in to Site24x7 client
- Navigate to Home > Monitor Groups > Create groups using templates.
- You'll be shown a dashboard view where multiple templates will be listed. You can click a template from the dashboard to build a relevant Monitor Group instantly.
NoteThe Monitor group and associated subgroups will not have any associated monitors, by default. You can associate multiple monitors to Groups and subgroups later.

Manual Configuration
Finally, you can also configure the Monitor group manually by specifying the relevant parameters in the Add Monitor Group form. Follow the steps listed below to build your Monitor Group:
- Log in to Site24x7 client.
- Click Admin > Inventory > Monitor Groups.
- Click the (+) icon or pick Create Group from the dropdown listed on the top right corner of your Monitor Groups page to set up your Monitor Group.
- Now provide the following details in the Add Monitor Group page to finish monitor group setup:
- Display name: Specify a name for the monitor group for easy identification.
- Description: Provide a description for the group.
- Group type: Pick a group type from among All types/Web/Server/Database to segment your existing monitoring resources based on type. Once you select a group type, you can customize your monitor group by adding or removing monitors from it. Choose “All types” to associate all the monitors to the group, regardless of the type.
NoteMonitoring resources under individual Group types:
Web Group:
Website, DNS Monitor, Domain Expiry Monitor, SSL Certificate Monitor, Real Browser Monitor, Web Page Analyzer, REST API Monitor, SOAP Monitor, Web Application Monitor, Website Defacement Monitor, Port (Custom Protocol), POP Server, SMTP Server, and FTP Server, APM Insight Monitor, Real User Monitor, and Mobile APM for Android and iOS.
Server Group:
Server Monitor, VCenter Monitor, VCenter Cluster Monitor, MS Exchange Monitor, Microsoft Active Directory, Microsoft IIS Server, Microsoft Hyper-V Server, Microsoft SharePoint Server, Microsoft BizTalk Server, Microsoft Office 365, Windows Cluster, Plugins, Probe, Classic Load Balancer, Application Load Balancer, Docker Monitor
Database Group:
SQL Server, RDS Instance, DynamoDB
- Select Monitors: Customize your monitor group by associating multiple monitors from your existing monitor resource pool. Select the type of monitor you want to include, then choose the specific monitors from the list. You can either select all resources, manually pick relevant monitors from the list, or even choose not to associate any monitors to the group. However, you must associate at least one monitor to help decide the group’s overall status.
- Monitor count threshold to decide the monitor group's status: Enter the preferred monitor count threshold value in order to decipher the status of your monitor group.
Note- Site24x7 decides the status of a monitor group based on the preset threshold value for the monitor count configured by the user. Learn how.
- If you've entered '0' as the monitor count threshold–Site24x7 will take into account all the monitors in the monitor group for determining the group's status. The default threshold value is always '1'.

- Include Related Monitors: Choose this option to include all the related monitors for the above selected monitors. Let's say, you're selecting a Server monitor from the Select Monitors list. In this case, all the related monitors of the selected Server monitor such as SQLServer, WindowsCluster, Plugin, and Database Insight will also get added to the Monitor Group.
- Add Subgroups: You can enter the comma separated names and create multiple empty subgroups to complete the monitor group creation. After an empty subgroup is created, you can access the subgroup and associate more monitors to it.
- Health Check Configuration: The Health Check feature monitors and tracks the overall health and availability of your Monitor Groups and Subgroups. Select the required health check profile from the drop-down list. Click the add icon + next to the Health Check Profile field to add a threshold profile for Health Check.
NoteTo edit the threshold profile, click the pencil icon
 next to the Health Check Profile field.
 - Configuration Profiles: Select or add tags to organize and manage monitors creatively. You can create unique tags by assigning simple name-value pairs and colors. To add a tag, click Add Tag. Enter the Tag Name, Tag Value, and select the Tag Color in the Add Tag dialog box, and click Save.
- Alert Settings
- User Alert Group: The User Alert Group organizes contacts and users to a particular group to receive alerts and notifications. Select the applicable User Alert Group for the monitor group.
- On-call Schedule: The On-call Schedule option ensures that the notifications are sent to assignees in specific shift hours helping them to respond to alerts or incidents quickly. Click the add icon to add an on-call schedule.
- Notification Profile: Configure the status-based alerting period and notification options for mediums (including SMS, voice, IM, push notifications, and third-party services supported by Site24x7) for Down/Trouble/Critical notification delays through the Notification Profile. Click the add icon to add a notification profile. To edit a notification profile, select the notification profile from the drop-down and click the pencil icon.
- Third-Party Integrations: This section displays the active third-party services available for the monitor group. To push your monitor alerts into your preferred third-party services, go to Admin > Third-Party Integrations and incorporate the required third-party services.
- Dependency Configuration:
- Dependent on monitor: You can choose a monitor from the drop-down list to customize your dependency configuration. You can add up to 20 monitors as dependent resources.
NoteIf you do not wish to update the Dependency Configuration, choose "None" from the Dependent Resource drop-down. Learn how to set up dependency configuration.
- Click Save.
- Once updated, the monitor group will be listed in the Monitor Groups list view.
- Dependent on monitor: You can choose a monitor from the drop-down list to customize your dependency configuration. You can add up to 20 monitors as dependent resources.
Automatic Configuration (AWS resources only)
AWS users can automatically roll up resources into monitor groups by leveraging our custom tag: group_site24x7. All you have to do is open the AWS management console of the supported cloud service and assign a case-sensitive tag with the key: group_site24x7 along with a value of your choice to the resources you want. For example, if you have multiple resource farms each performing a specific function (web Server, message broker, database) you can automatically create individual monitor group for each farm to visually monitor the operational health of all the compute instances powering your deployments.
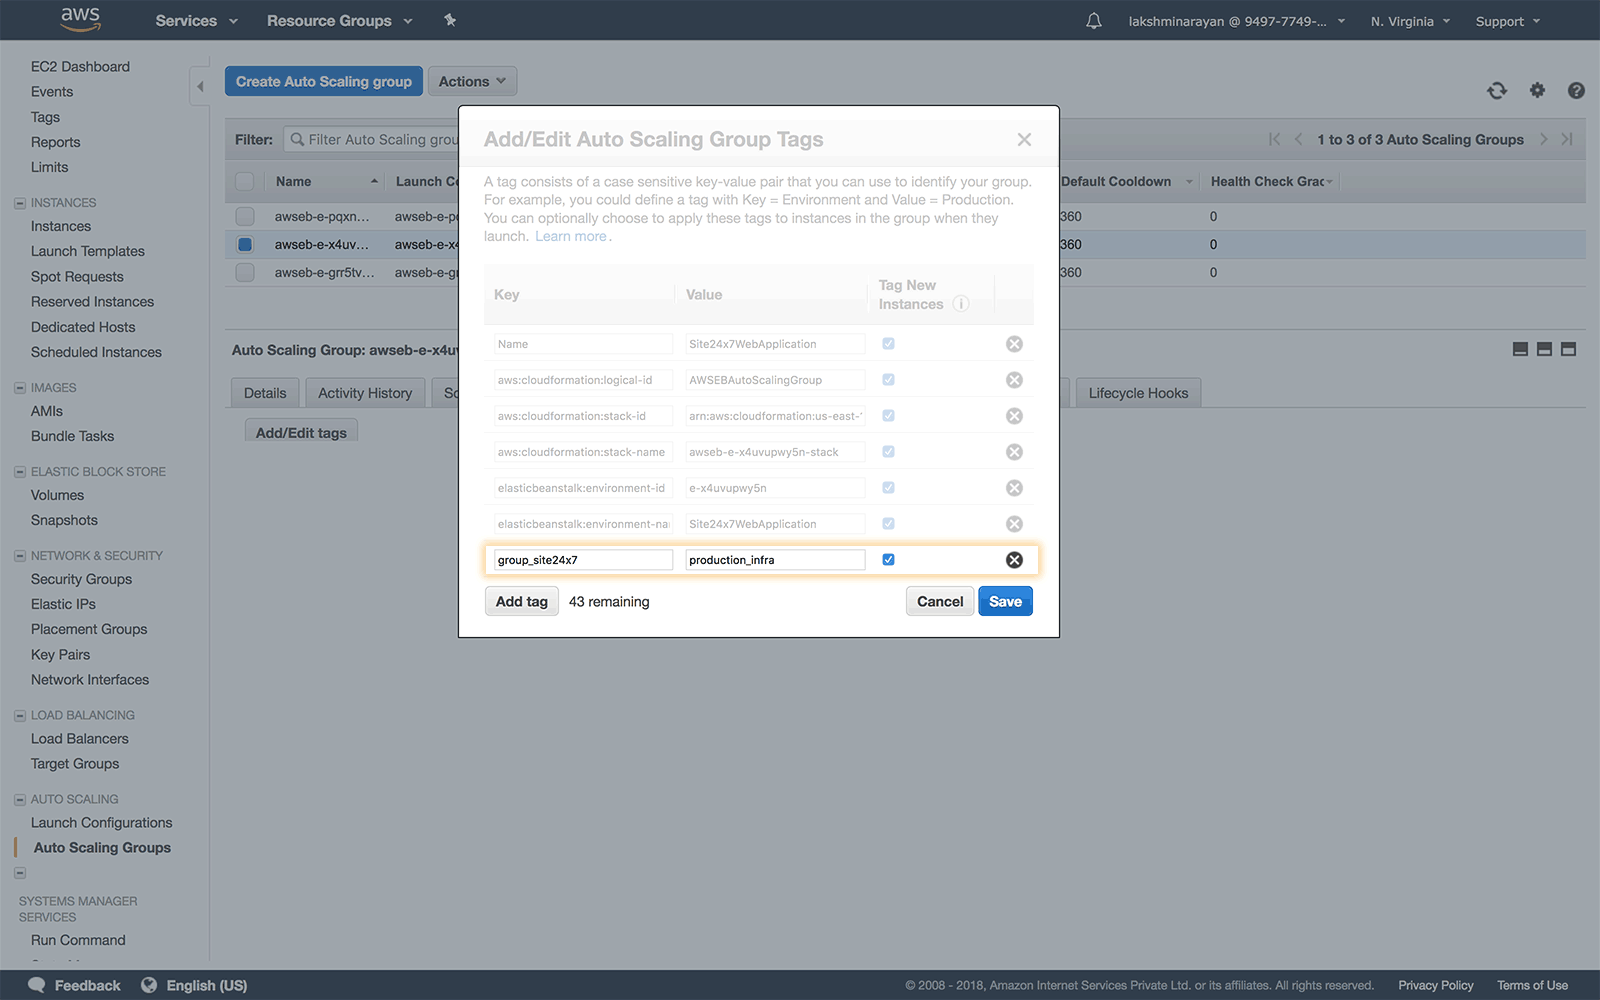
The Steps for how you can add a tag to your AutoScaling group is shown below:
- Sign in to the Amazon Elastic Compute Cloud (EC2) console.
- In the left navigation pane, under Auto Scaling choose Auto Scaling Groups. Select your Auto Scaling group.
- Click on the Tags tab and choose Add/Edit tags (The page lists all existing tags for the AutoScaling group)
- Now, choose Add tag, and type in the key: group_site24x7 and value of your choice (for example production_infra)
- Keep the Tag New Instances checkbox selected to apply the tag to all newly launched instances. (This ensures that the Site24x7 monitor group stays up to date).
- Choose Save.
Monitor Group creation
After you’ve finished, Site24x7 automatically creates a new monitor group by name production_infra and rolls up all the EC2 instances into the group in the next poll.
Always in sync
The Tags that you assign get synced with Site24x7 during every poll (5 minutes). This ensures that the Monitor group created always states up to date.
Viewing monitor groups: Card view and List view
You can choose how you want to view your monitor groups, either as visual cards or in a list format. Both Card and List views are supported for monitor groups and their subgroups.
You can choose the desired view at the top-right corner of the Monitor Groups page as applicable. The selected view will apply to both monitor groups and their subgroups. This flexibility allows you to choose the layout that best suits your monitoring needs and working style.
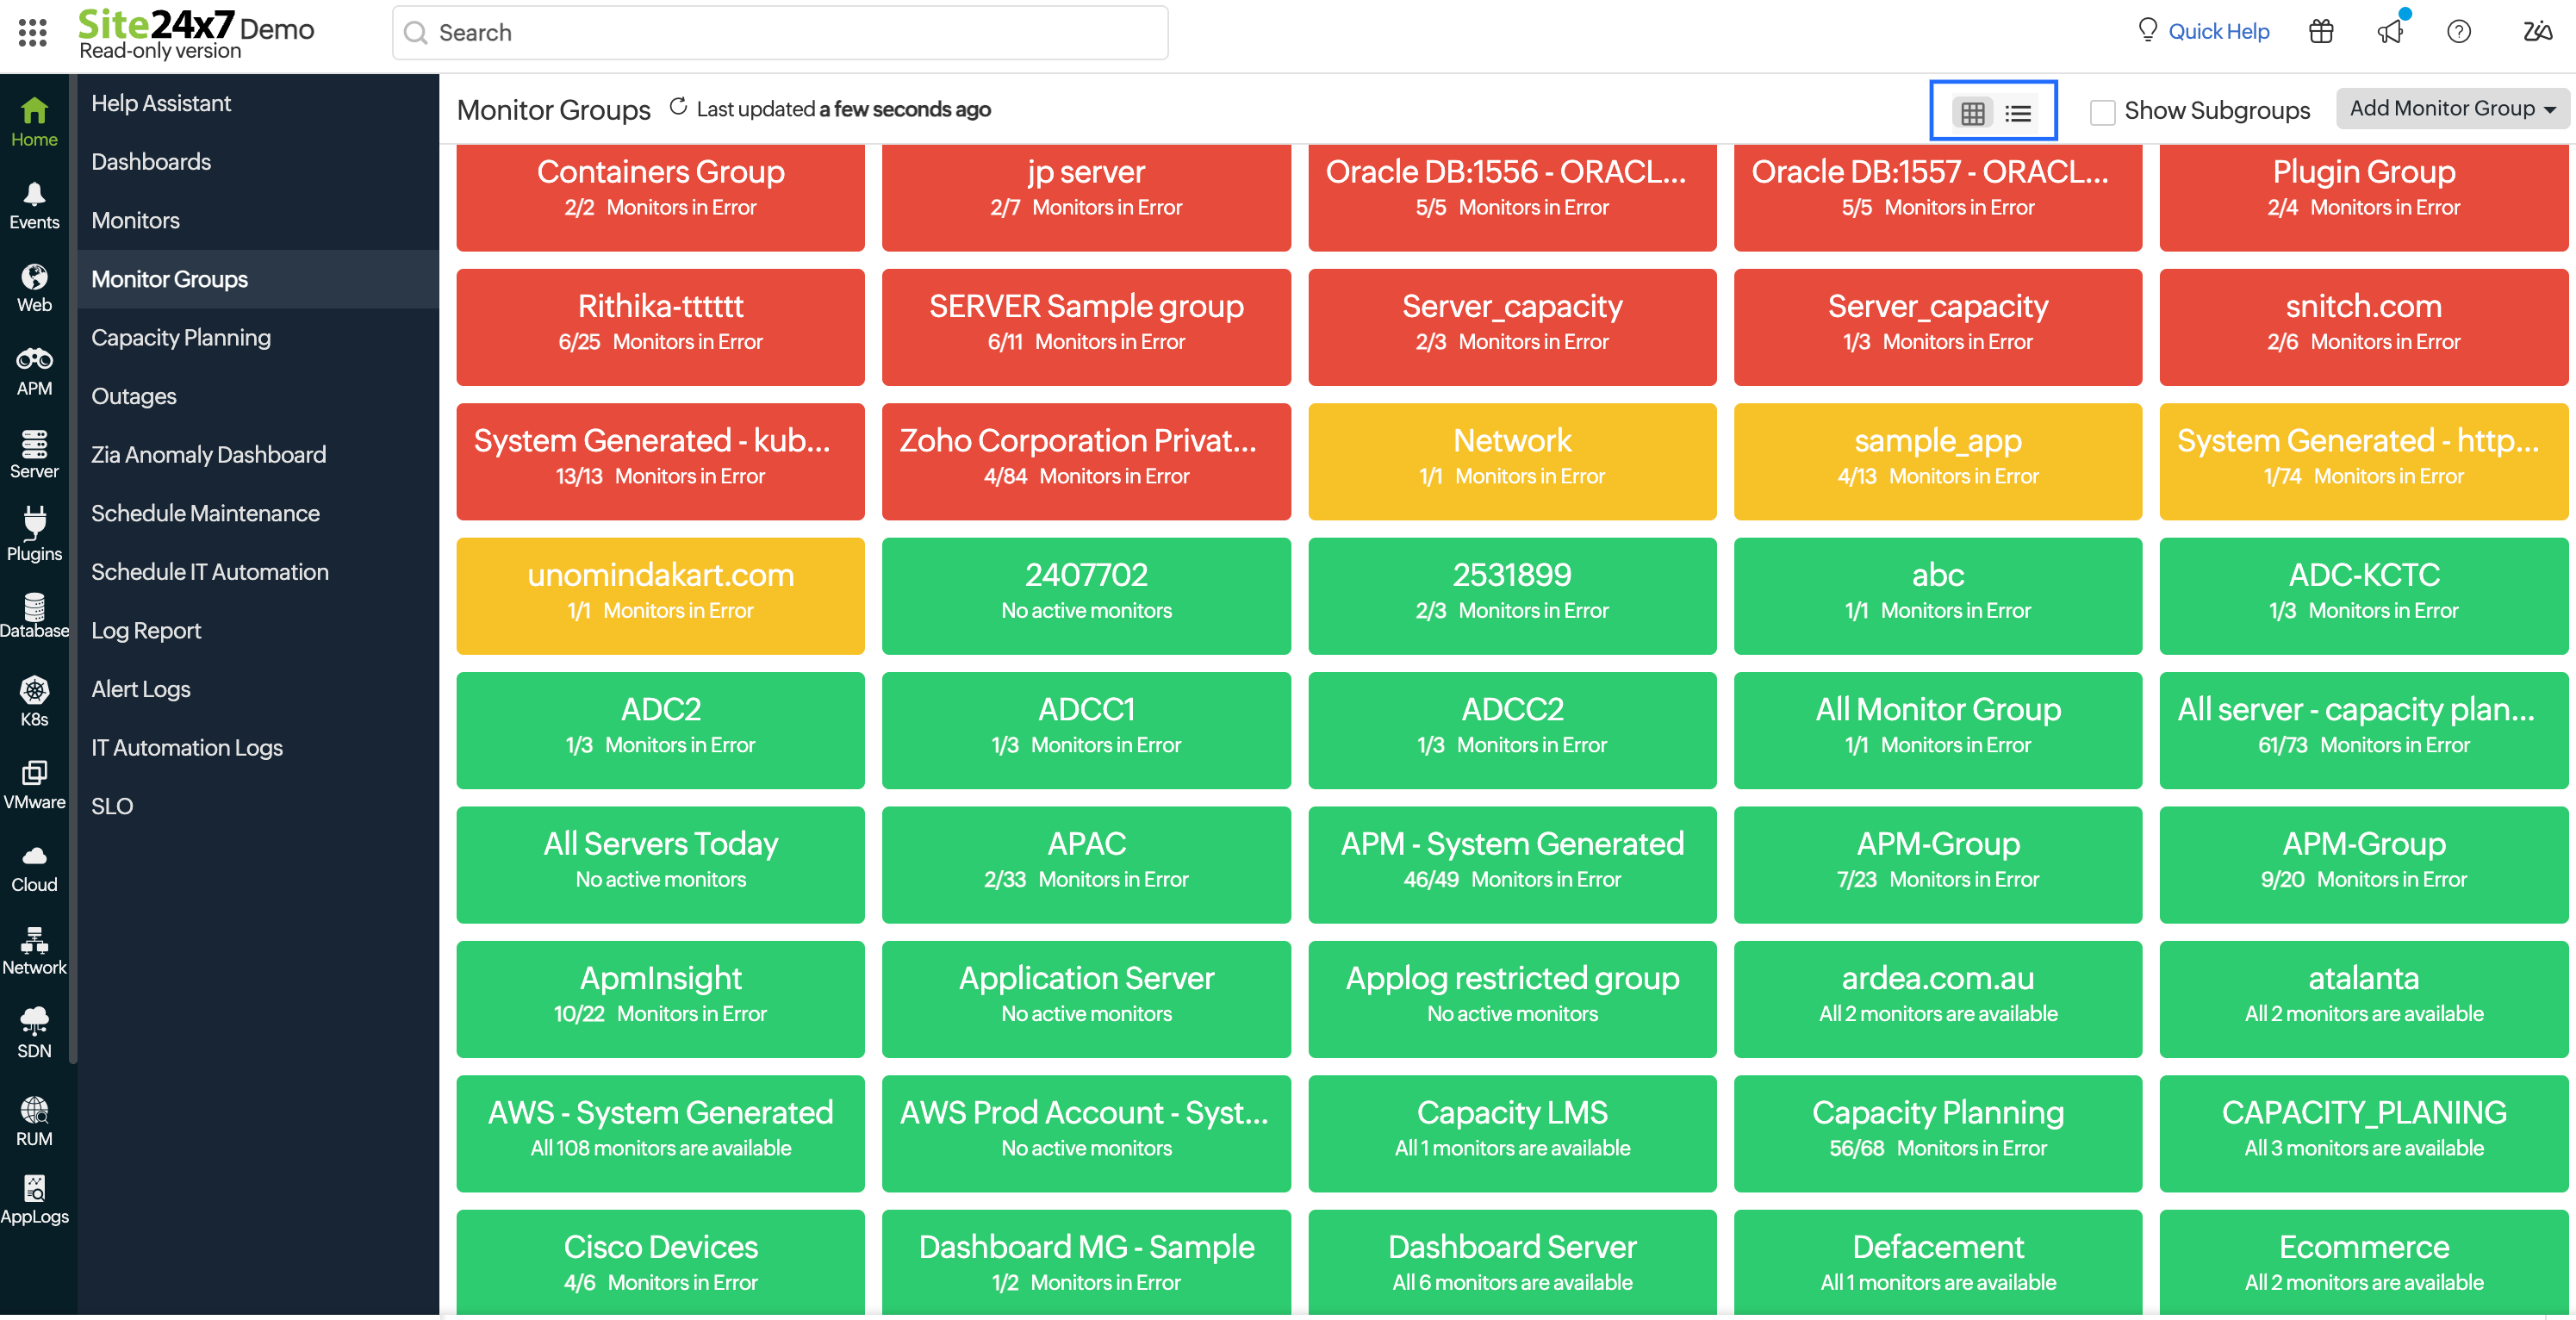
Card view
The card view will be deprecated and will not receive further updates. The list view is now the default experience going forward.
Each group appears as a separate card. This view helps you quickly assess the health of each group at a glance and is ideal for environments with fewer groups or when a visual overview is preferred.
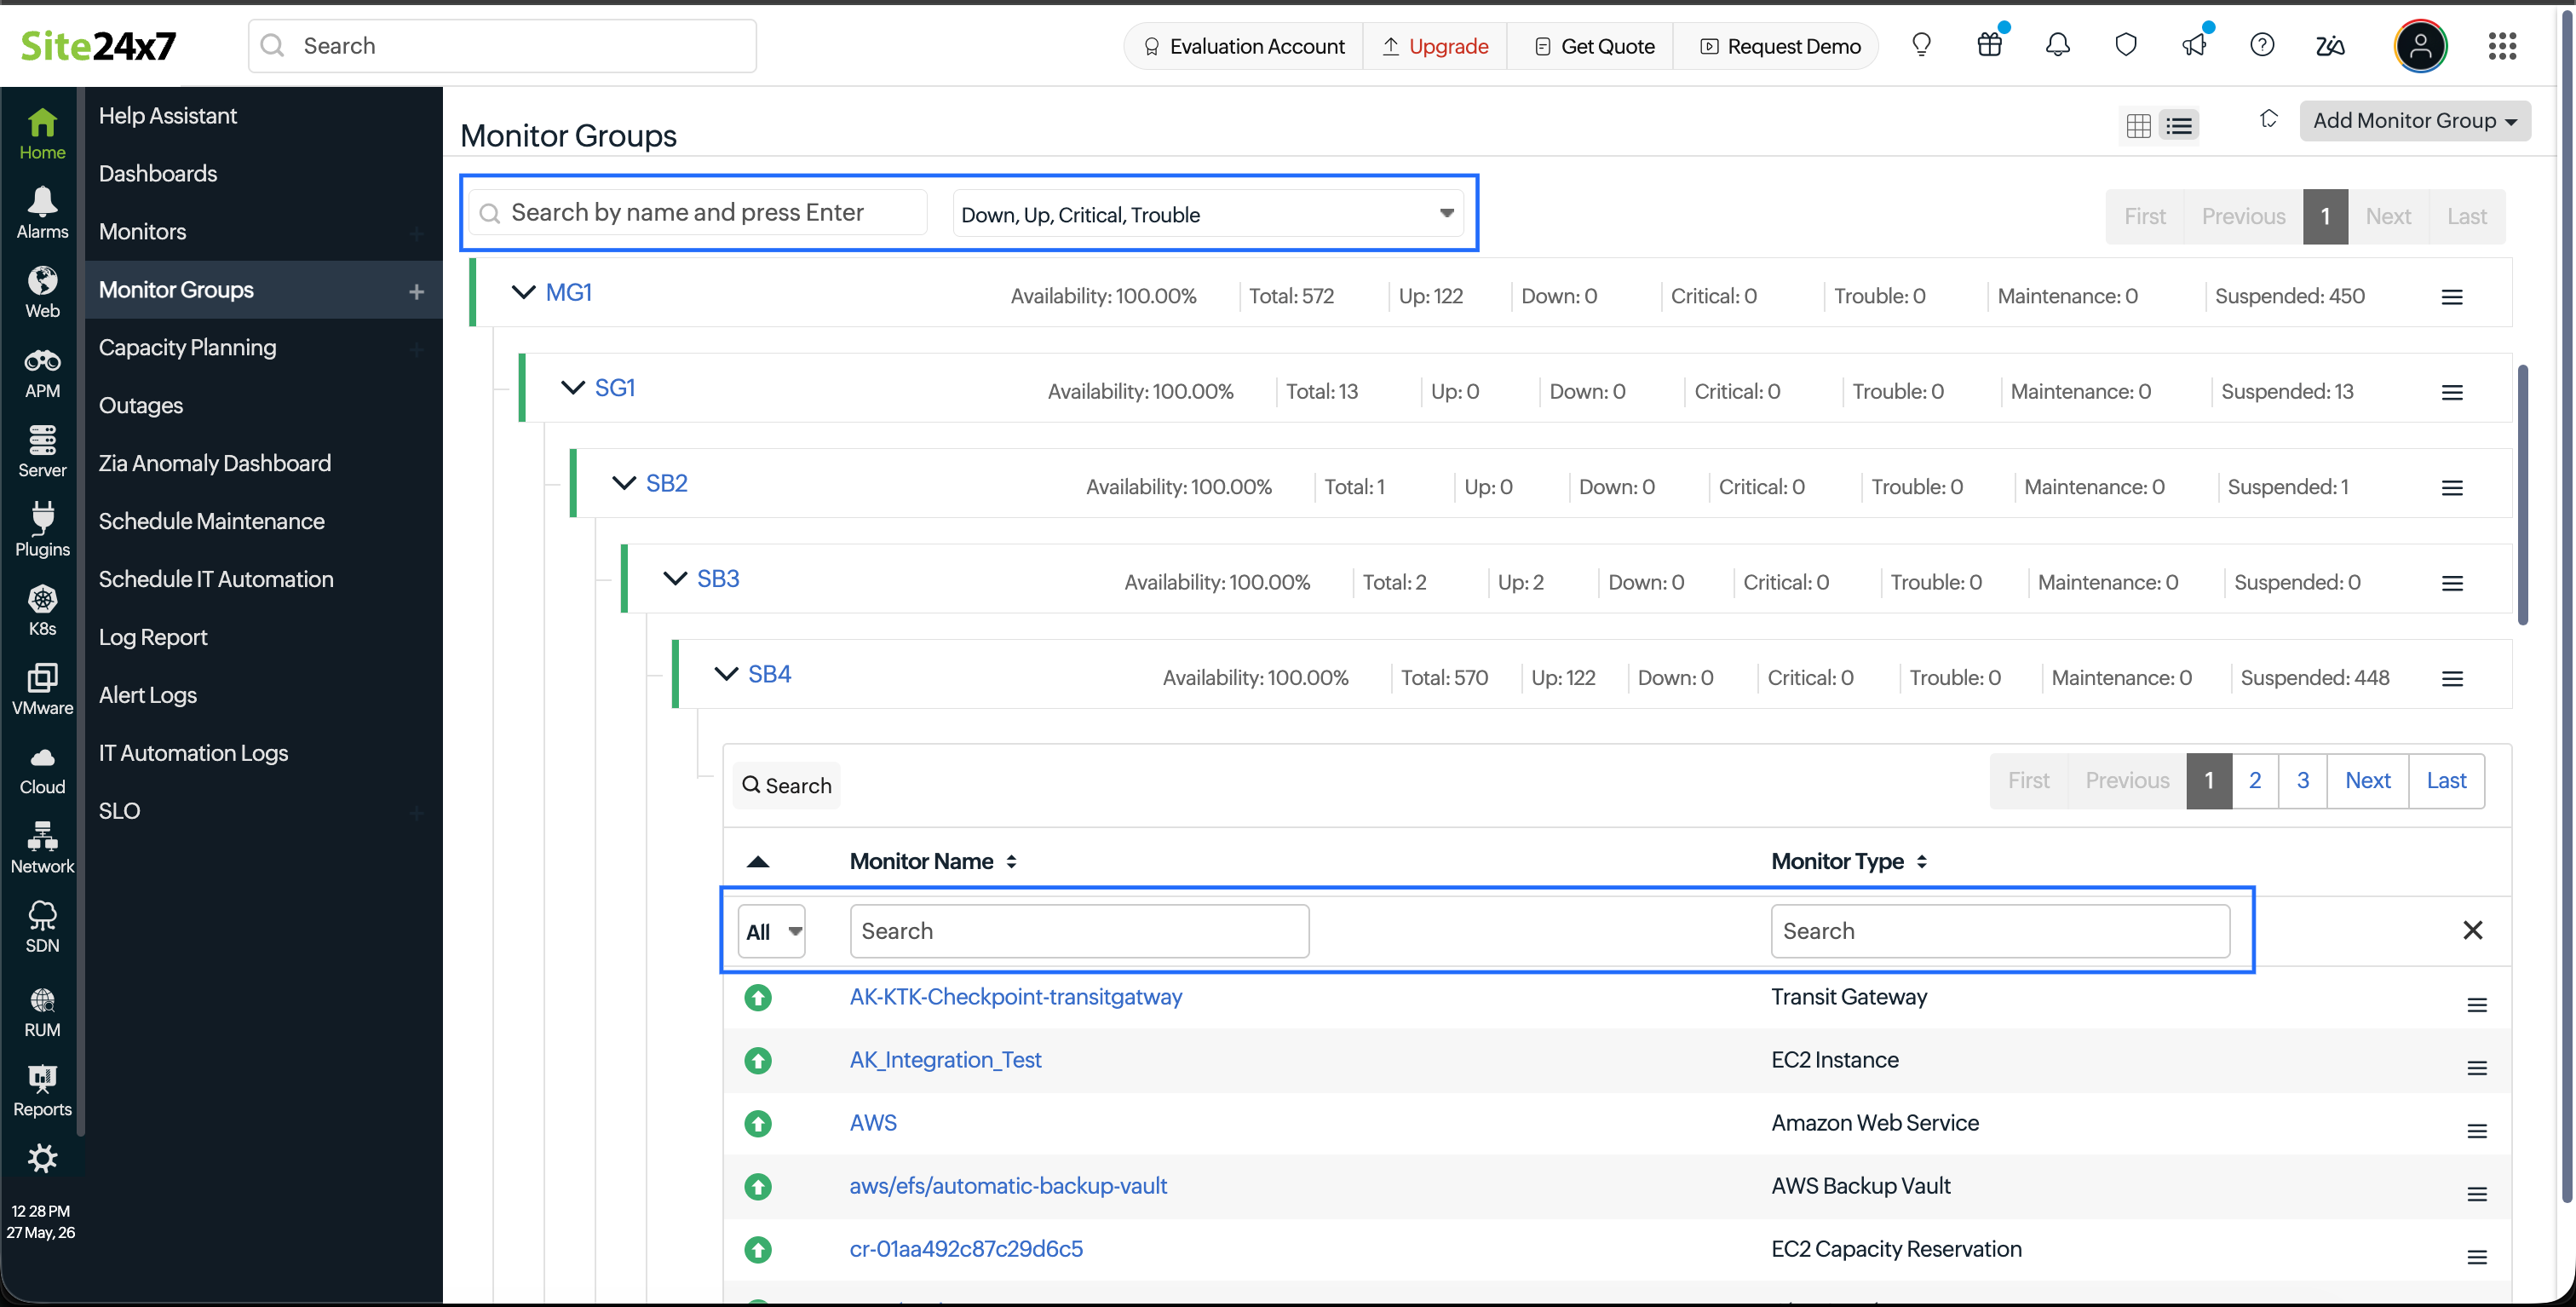
List view
You can switch to List view to see your monitor groups in a more compact, tabular layout. This view displays the monitor group names and subgroups in a nested structure that helps you manage hierarchy without losing context. It enables you to expand monitor groups and subgroups to view all associated monitors in a single page. This eliminates the need to open each monitor group or subgroup separately and provides a consolidated view of your monitoring setup.
From this view, you can check monitor availability, review key details such as monitor name, monitor type, and current status, and manage monitors without leaving the page. This is especially useful when working with large environments that include multiple nested monitor groups and subgroups.
Click the search bar to find a specific monitor by name and quickly locate it within the expanded list. You can use the status dropdown menu to view monitors based on their current state, such as Down, Up, Critical, Trouble, Suspended, or Maintenance. This helps you quickly focus on monitors in a specific condition. You can also search the list by monitor type to view only the resources you need. In addition, you can perform monitor management actions such as edit, add to monitor group, activate, and delete using the hamburger icon available for each monitor.
Search and filter options
The search bar at the top of the page lets you locate specific monitor groups or subgroups.
- Searching by parent monitor group name: Enter the full name of the parent monitor group to view that group along with all its associated subgroups. The complete hierarchy for that group will be displayed.
- Searching by subgroup name: Enter the full name of a specific subgroup to view the searched subgroup along with the monitor group it is associated with. Other subgroups or hierarchy levels from the same monitor group will not be shown.
Search results are not auto-suggested. You need to type the exact name of the monitor group or subgroup to retrieve results.
Next to the search bar, you can use the status filter to narrow down the results. Available status options include Up, Down, Critical, and Trouble.
Selecting a status filter will display only monitor groups or subgroups that match the chosen status. This helps focus on problem areas or verify groups in a specific state.
Capacity Planning
Capacity Planning for Monitor Groups provides the analytical data for a group of monitors and is used to determine the capacity required to optimize resources for a particular operation or workload. You can create Capacity Planning Monitors under a monitor group and track the health and performance status of individual resources grouped under a Capacity Planning monitor.
Health Check
The Health Check feature monitors and tracks the overall health and availability of your Monitor Groups and Subgroups. Imagine you have a group of servers, databases, and services working together to run a critical application. Monitoring each component individually and compiling their availability data is challenging. This is where the Health Check feature comes into play. It helps you view, analyze, and manage the status of your monitor group along with its availability.
Health Check is automatically enabled when you create a Monitor Group or Subgroup. As a result, you can instantly view the overall health and status of your Monitor Group and get notified of individual resource outages.
Whenever a resource undergoes a status change, you receive a detailed root cause analysis and can identify the impact at Monitor Group level. Furthermore, the resource status change is instantly propagated to the Monitor Group and gives you a combined alert at Monitor Group level resulting in alert noise reduction.
Customize Dependency Configuration
During a potential catastrophic failure of your IT infrastructure, it is highly likely that you may burn through all your notification credits fairly quickly due to redundant alerts. Site24x7 has a built-in false alerts protection system that lets you configure dependent monitor in your monitor groups to alleviate such worst case scenarios. You've to set up a dependent resource in your monitor group, which would then dictate and suppress alerts sent to other resources, based on its down status. Follow these steps below to activate Alert Suppression for other resources and thus protect your alert credits from unforeseen usage. Explore more about Alert Suppression.
- Choose a Dependent Resource from the drop-down. You can choose up to 20 monitors as dependent resources.
Note
- You can select a dependent resource based on your intelligent grouping of resources. If you've a set of app-server monitors (URL monitors, SSL etc.) and a firewall monitor (Ping monitor/Port monitor) in your monitor group, you can control the alerting function of the app-server monitors by associating those monitors with the firewall monitor's down status–thus enabling false alerts protection to your account. You can add up to 20 monitors as dependent resources.
- The check frequency of the dependent resource will be tuned down to the least value to ensure that the delays between checks while "UP" and delays between checks while "DOWN" intervals are significantly less than any of the resources that depend on it.
- Click the check box "Suppress alert when dependent monitor is down" to activate alert suppression for other resources.
Note- During a poll, if a specific resource in the monitor group is identified as down, Site24x7 will auto-check and verify the dependent monitor's status first, even before notifying you with the specific monitor's status.
If a specific resource in the monitor group is detected as down and simultaneously, the dependent monitor is detected as:- Down, Site24x7 will suppress the alerts targeted towards the specific resource.
- Up, Site24x7 will identify the specific resource as down and trigger an alert.
- Polling is in progress, Site24x7 will wait for the dependent resource's status, before deciding on whether to trigger an alert for the resource or not.
- Under maintenance, Site24x7 will not trigger any alerts for the related resources.
- When an alert is suppressed for a monitor based on its dependency configuration in the monitor group, an entry is logged in the alert logs mentioning the same.
- All alerting modes including, SMS, Voice, IM, Mobile push notification, and Web browser push notification will be suppresed on the activation of this setting.
- During a poll, if a specific resource in the monitor group is identified as down, Site24x7 will auto-check and verify the dependent monitor's status first, even before notifying you with the specific monitor's status.
- Click Save.
Create/Modify Subgroups
Site24x7 allows you to customize your IT infrastructure grouping by allowing you to create multiple Monitor Groups and Subgroups as per requirement. It facilitates easy administration of your monitoring infrastructure. Any Monitor Subgroup created under a parent Monitor Group can be viewed from the Home > Monitor Groups or the Monitor Groups list view (in a nested view) in the Admin Inventory tab. You must click the Show Subgroups button to enable it in Monitor Groups dashboard. All the monitors under the parent Monitor Group along with the associated Monitors in the Subgroups will also be displayed under the Monitors list in the Monitor Groups Summary screen in Home tab. You can always edit or delete an existing Monitor Subgroup. Subgroups are created only as a part of setting up a business view; it's not intented for any alert suppression or status propagation.
How to create a subgroup?
You can create subgroups via any of the following means:
- Access Home > Monitor Groups > Monitor Groups details dashboard > Choose the Monitor Group of your preference.
- Access the
 icon displayed on top of the Monitor Groups details dashboard and pick Subgroups from the dropdown. Once the Add Subgroup window opens up, you can start to Add/Edit/Delete Subgroups.
NoteAdding a subgroup option is provided only for parent Monitor groups.

- Another way is to access the Business View dashboard. Double tap the mouse inside the parent Monitor Group to Add Subgroup/Edit Group; or, double tap the mouse inside a subgroup to create another nested subgroup, edit/delete the subgroup.
- You can click the Add Subgroup button to create a new Subgroup. By clicking the icon "X", you can instantly Delete a Subgroup.
- Specify a name and description to your subgroup.
- Subgroup type: Pick a subgroup type from among All types/Web/Server/Database to segment your existing monitoring resources based on type. Once you select a group type, you can customize your subgroup by associating or removing monitors from it. Choose “All types” to associate all the monitors to the subgroup, regardless of the type.
- Select monitors: Customize your subgroup by associating multiple monitors from your existing monitor resource pool. Select the type of monitor you want to include, then choose the specific monitors from the list. You can either select all resources, manually pick relevant monitors from the list, or even choose not to associate any monitors to the group. However, you must associate at least one monitor to help decide the subgroup’s overall status.
- Monitor count threshold to decide the group's status: Enter the preferred monitor count threshold value in order to decipher the status of your subgroup. Learn how Site24x7's decides the status of the group.

- In the Business View dashboard, click the Modify Business View legend displayed on the top right corner. This will enable you to add/edit/delete subgroups and concurrently modify the business view.
NoteYou cannot create a subgroup from the Admin > Inventory > Monitor Groups screen. However, you can always view all the associated subgroups of a monitor group (in a nested view) by selecting the Show Subgroups button.
Rules and limitations for creating Monitor Subgroups:
- Each Monitor Group can have its own Subgroup chain upto level five. (A1 to A5)
- There is no limitation on the number of Subgroups that can be added under a parent Monitor Group. (A2 to n2)
- A Monitor Group can only have one tree having itself as the parent Group. (There can be only one tree with A1 as the parent)
- Any particular subgroup can be present only once per tree. It cannot be associated with a second Monitor Group, once it's already associated with a monitor group in the first place (B3 can exist as a subgroup only once under any Monitor Group in your account.)

Reports and maintenance for Subgroups
- Opt to include Subgroups while scheduling reports.
- Opt to include Subgroups while scheduling maintenance for monitors in that Subgroup.
- Choose to include Subgroups while performing bulk actions.
- Enable Include Subgroups option while creating your Performance, Global Benchmark, Availability Summary, Step summary, Health trend reports to include subgroups of the selected monitor groups.
Managing a User
A Super Admin or Admin can manage access permissions for users associated with a monitor group. This can be done by,
- Navigating to the monitor group of your preference.
- Click the hamburger icon > choose Manage User Access.
- In the Manage Users Access Permissions for this Monitor Group pop-up that opens, click Add User and choose the users of your preference.
- Click Save, once done.
When you unselect a user from the menu, the access permissions of the user to the group will be revoked.
Admins with group-level permissions can manage (associate and dissociate) only the users they've created to those groups for which they've access permissions.

Only those users who're allowed to access monitor groups will be listed in the drop-down.
Groups Filtering
Monitor group wise filtering in the following user forms/dashboards are made available. In all these instances, only Parent Monitor Groups will be listed. Nevertheless, whenever a Parent Monitor Group is selected, monitors associated with the subgroups of the Parent Group will also be considered and added to the list automatically.
- Users an Alerts Form
- Schedule Maintenance Form
- Scheduled Report Form
- Status Page Form
- Operations Dashboard Form
- Public Reports
NOC view in Monitor Groups
While the NOC View option on the Home page allows you to view all the monitors, the NOC View option on the Monitor Group page allows you to view the monitors of that specific monitor group.

Outages
The Outages tab provides a consolidated view of outage events for the selected monitor group. It helps you track downtime incidents across all associated monitors and analyze outage duration, root cause, and impact within a selected time period.
The Outages tab displays the following details for each outage event:
- Monitor Name: The monitor that experienced the outage.
- Start Time: The exact time when the outage began.
- End Time: The time when the monitor recovered from the outage.
- Duration: The total outage duration.
- Reason: The reason or root cause associated with the outage.
- Latest Comment: Displays the latest outage related comment or update, if available.
You can use the time period drop-down menu at the top-right corner to filter outage data for a specific duration, such as Last 24 Hours, Last 7 Days, or custom time ranges. If no outages are detected during the selected period, the page displays a corresponding message indicating that no outage events were recorded.
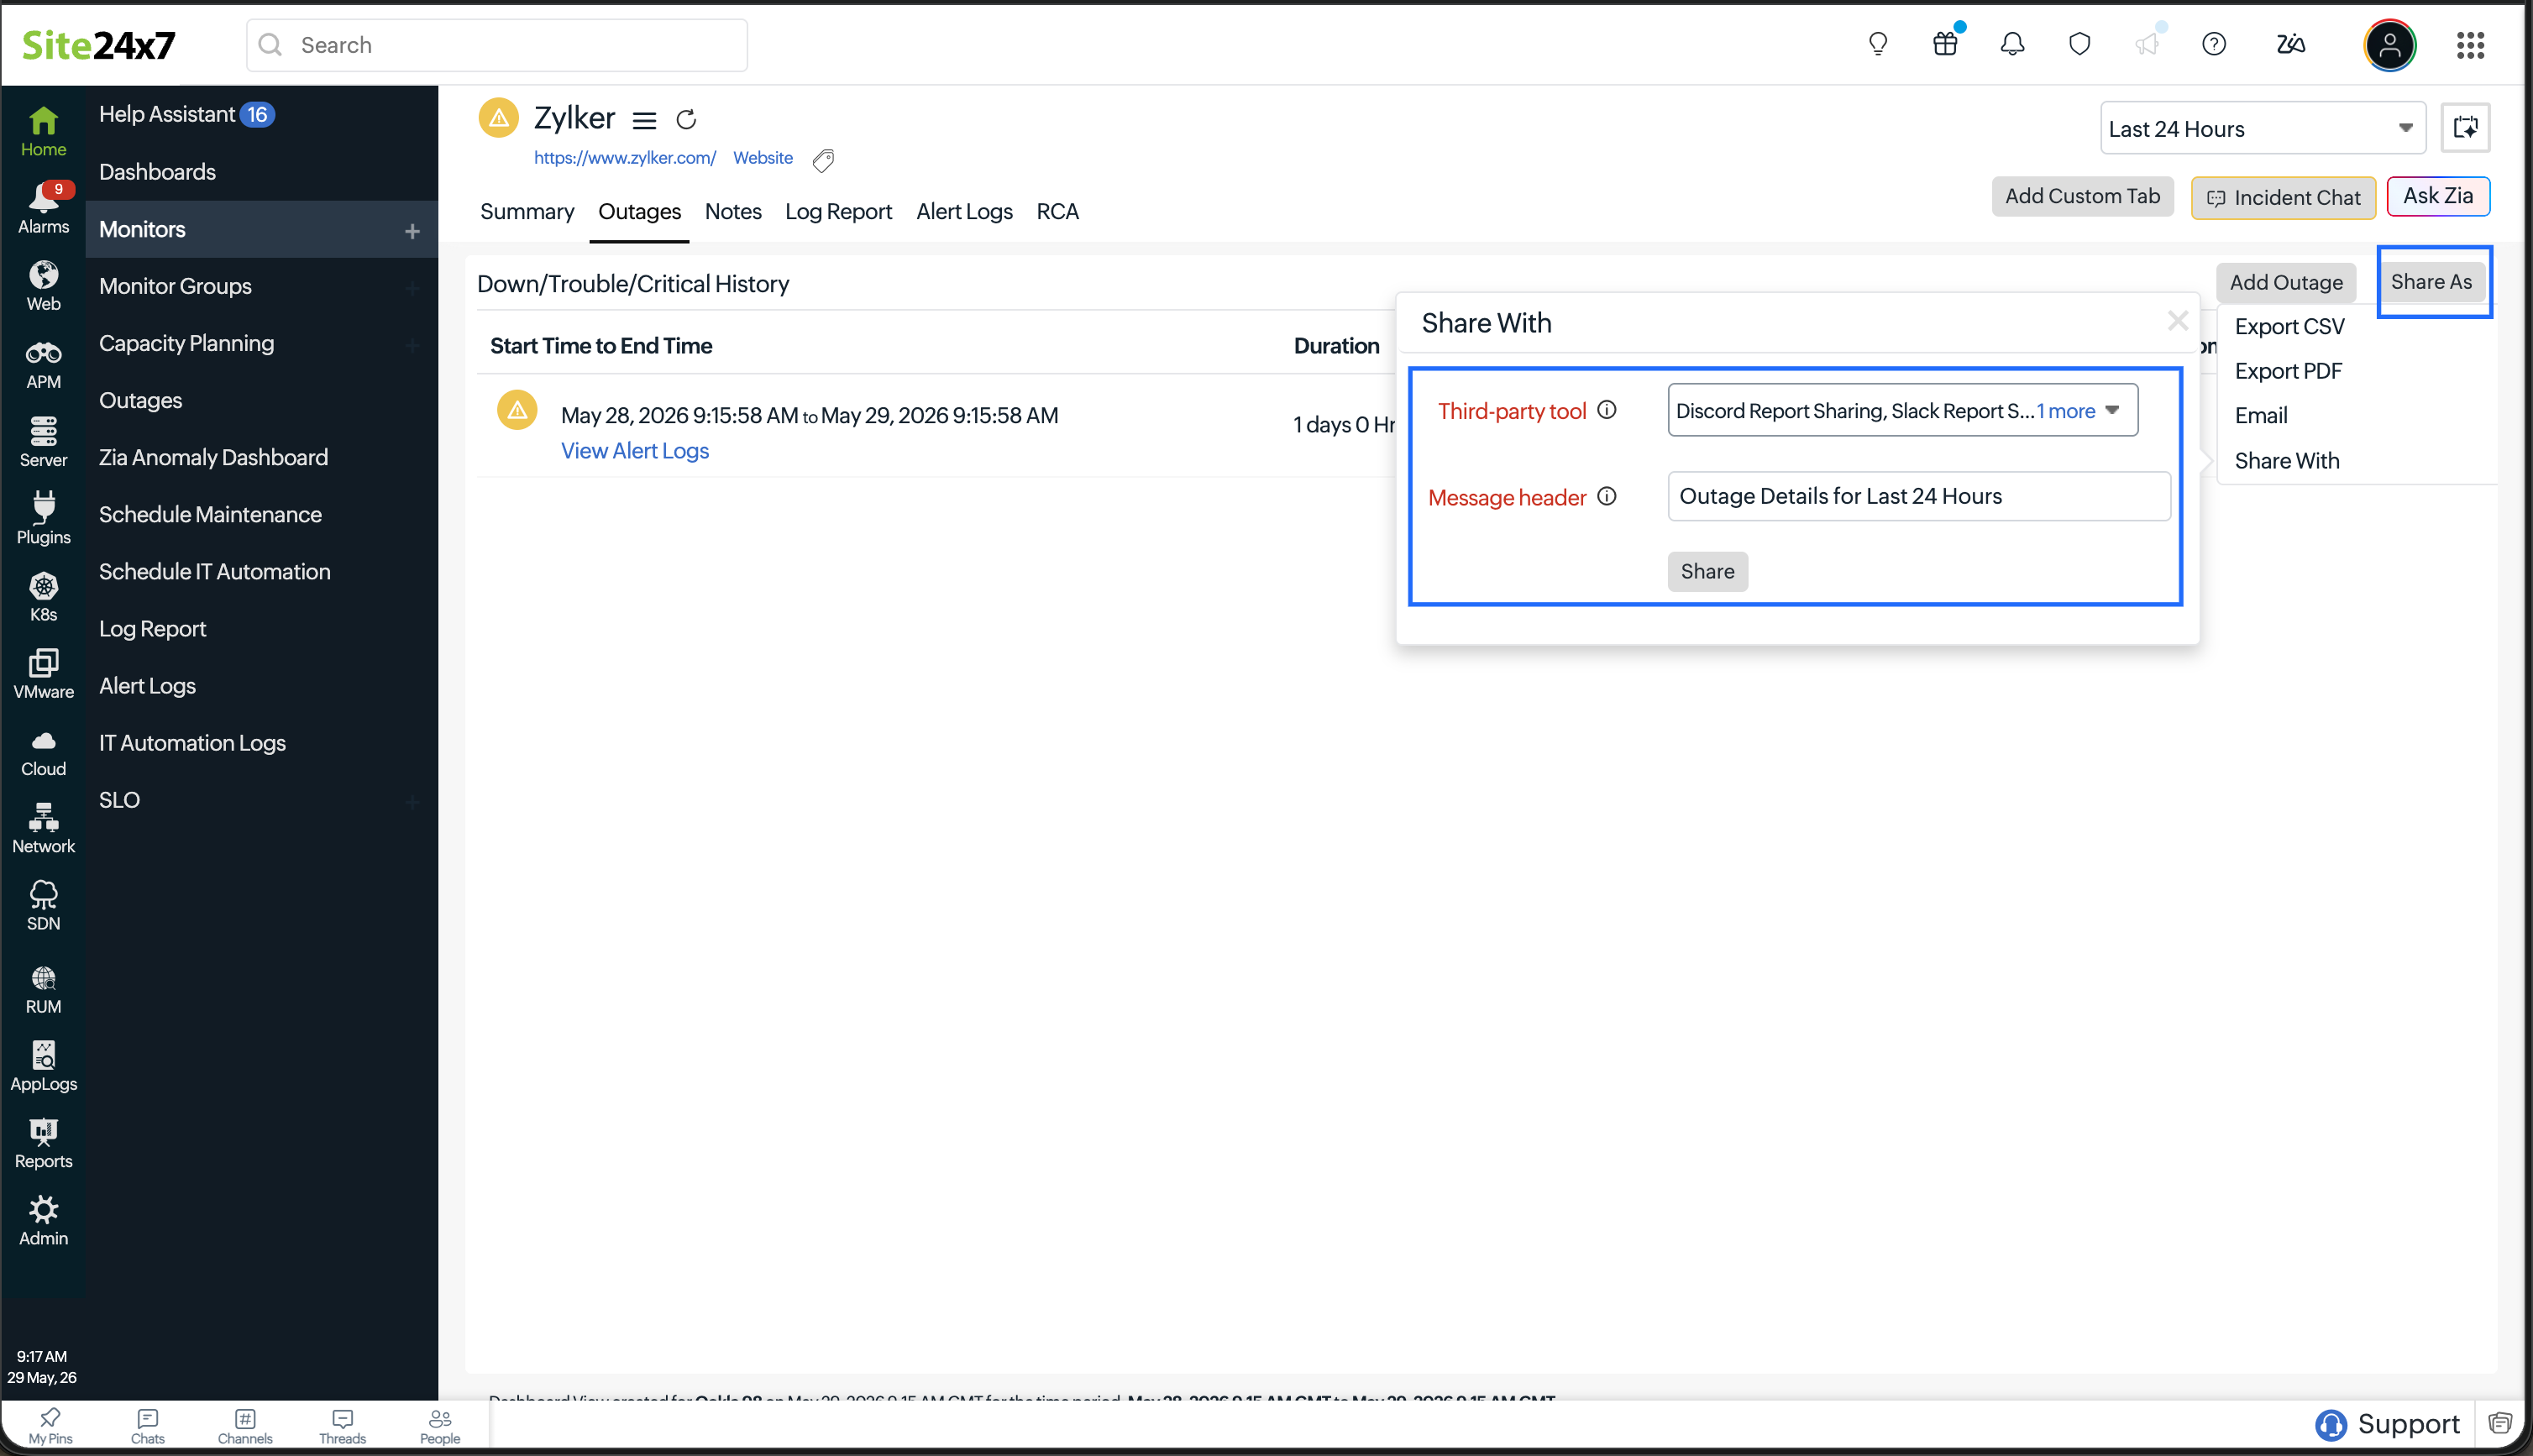
Share outage reports
Click the Share As option to export or share outage data in different formats. The following options are available:
- CSV: Export outage details in CSV format for further analysis or reporting.
- PDF: Download the outage report as a PDF document.
- Email: Send the outage report through email.
- Share With: Send outage data directly to supported third-party tools.
The Share With option is available only when a supported third-party integration has already been configured for the selected tools.
When using the Share With option, you can configure the following:
- Third-party tool: Select the third-party tool where the outage report should be sent.
- Message header: A default message header is provided. You can modify it to customize how the notification header appears in the shared message.
- The Share As option is available for integration tools such as Slack, Telegram, and Discord.
- To verify whether the data has been successfully sent to the third-party tool, check the Logs page. This displays the status of each request and helps you confirm whether the data transmission was successful or if any errors occurred.
Recommendation
Create a separate integration channel for sending reports instead of using the same channel configured for alerts. Using a dedicated channel helps maintain clarity and ensures that reports are not overlooked or mixed with alert notifications.
Business View
Monitor Subgrouping in Monitor Groups offer a simple yet intutive way to organize your resources and ease administration. It helps you quickly gain attention about any unusual patterns in your monitors with a bird's-eye-view of your infrastructure. Site24x7 Monitor Group Business view tab can be accessed as part of the Monitor Group Details View screen in Home tab. Business view instantly helps you spot outliers and detect unusual monitoring patterns in your Monitor Group and associated Subgroups. These actionable insights can be used to make decisions about how to best manage your infrastructure. By setting up multiple Monitor Subgroups under your parent Monitor Group, you can visualize your IT infrastructure like never before.
Business view allows you to easily filter out details about availability of individual monitors, monitor groups and subgroups. It has an inbuilt Collapse/Expand Group(s) tool  and Magnified Inspector. The can be used to collapse or expand the Monitor Subgroups. In this view–whenever a monitor subgroup is DOWN, the circle intermittently blinks red to capture your attention. The parent Monitor Group will never collapse, though. Similarly, the Magnified Inspector tools can be used to zoom in
  and zoom out
  of individual Monitor Subgroups, to gather accurate monitor status of individual monitors in the Monitor Group. Every monitor in a monitor group / subgroup are depicted as a circle, with each circle color coded to showcase the current monitor status. Red circles are identified as DOWN, orange circles are CRITICAL, yellow circles are TROUBLE, and green circles are UP. Details about the number of Active Monitors and status of individual monitors in each subgroup can be obtained by simply hovering over each circle. In the business view, the individual subgroups will be rendered as circles with the outer boundary of each circle color coated to depict the group's status. If you wish to set the default business view, just click the Refresh button. In the default view, you can view the expanded circle with all the monitor circles in a single shot.
If you wish to see the performance statistics or root cause of a specific monitor's outage, you can view that too. Simply click the relevant circle that identifies the monitor. For monitors with an UP, CRITICAL, or TROUBLE status, the performance statistics report will be rendered on mouse click. For DOWN monitors, the root cause analysis report will be generated, if available.
Performance Statistics report for UP, CRITICAL, or TROUBLE monitors highlight the Basic monitor details along with outage duration, global status and performance graph.
RCA for DOWN monitors will highlight the basic monitor details, downtime reason and duration along with monitor recheck report or traceroute details based on the selected monitor type.
Business view is unavailable for monitor groups exceeding 200 monitors. This includes monitors in both monitor group and sub groups.

Events timeline widget
Events timeline records all the past events of monitors in your business view for a selected time range. You can identify/decode various events from the past, which includes Down, Critical, Trouble, Maintenance, Suspended, or Anomalies. Each event are color coded for easy identification. Events can be drilled down to extract maximum data and facilitate easy troubleshooting. You can also track the actual outage period and the total outage duration during a specific block of time. It offers a granularity of up to one milli second.

You can aswell modify a business group by adding or updating your monitor groups and subgroups. Use the  to modify the business view. Alternatively, double tap inside the monitor group / subgroup to add/edit/delete the same.

View Monitor Groups Control Panel
Monitor Groups help you to organize resources (Monitors) by business application, geography, type or resource ownership. It's an easy concept for resource administration. You can easily access all the monitors groups from a single control panel without too much navigation. It also identifies each Monitor Groups based on their status color codes. DOWN monitors are grouped in red. Orange is used to identify monitors that are in critical status, yellow identifies monitors in trouble status. Monitors under maintenance are grouped under purple, available monitors are shown in green; finally, Monitors that are suspended are shown in grey.
On selecting a relevant monitor group, you can gain further insight into metrics like availability and performance of the monitor group for a selected period of time. The Summary control panel offers specific detail with the help of widgets like Event Timeline (offering information on various outage and anomalous events, including outage duration and exact outage period), Monitor list (all the monitors in the parent Monitor Group will be displayed under the Monitors list) and their status. An Outages control panel gives visibility into individual monitors downtime by helping you to deep dive into resources and track the performance response time (in ms) and outage duration of all the individual monitors in the group. You can use the business view to gather a high level picture on how your monitors are organized inside monitor groups and how they're performing individually. Anomaly tab tracks and portrays all the performance deviations for a specified range with tabular reporting. You can use the Magnified Inspectors to navigate across to a definite time range for tracking performance.

Licensing
Licensing limits for Monitor Groups and the number of monitors within each group vary based on your subscription plan. The Monitor Group licensing limitations are explained below.
Key licensing limitations
- Parent and sub-groups are both counted towards your monitor group limit.
- Default Monitor Group limit (for all packages except the Enterprise pack):
- Up to 500 Monitor Groups
- Enterprise pack limit:
- Up to 1,500 Monitor Groups (500 × 3)
Enterprise pack allocation
Enterprise users get an additional allowance based on the number of active monitors:
- Formula: 1,500 + (10% of total active monitors)
Example:
If you have 50,000 active monitors:
- 10% of 50,000 = 5,000
So the total number of Monitor Groups allowed is 1,500 + 5,000 = 6,500
This total includes both user-generated and system-generated Monitor Groups.
Monitors per group
Each Monitor Group can include:
- Up to 5,000 monitors (default limit for all plans)
Related articles
-
On this page
- Adding a Monitor Group
- System Generated
- Using Default Templates
- Manual Configuration
- Automatic Configuration (AWS resources only)
- Viewing monitor groups: Card view and List view
- Capacity Planning
- Health Check
- Customize Dependency Configuration
- Create/Modify Subgroups
- Managing a User
- NOC view in Monitor Groups
- Outages
- Business View
- View Monitor Groups Control Panel
- Licensing