Performance Metrics for Windows Failover Cluster
Get the number and status of all the nodes in a Windows cluster, network reconnections, storage stats, and state of the resource groups. The cluster monitor uses the Site24x7 Windows agent for monitoring. Install the Windows agent and get your failover clusters auto-discovered.
Once the failover cluster monitor is successfully added to your Site24x7 account,
- View performance metrics for cluster monitors. Log in to Site24x7 and go to Server > Microsoft Failover Cluster.
- Add a Threshold and Availability profile to declare a specific resource as critical or down. Go to Admin > Configuration Profiles > Threshold and Availability (+).
- Analyze trends and identify performance issues with exclusive performance reports.
- View key metrics in a single glance with the server inventory and health dashboards, or create your own.
Interpret Microsoft Failover Cluster Performance Metrics
The following metrics are provided for the Failover Cluster monitor:
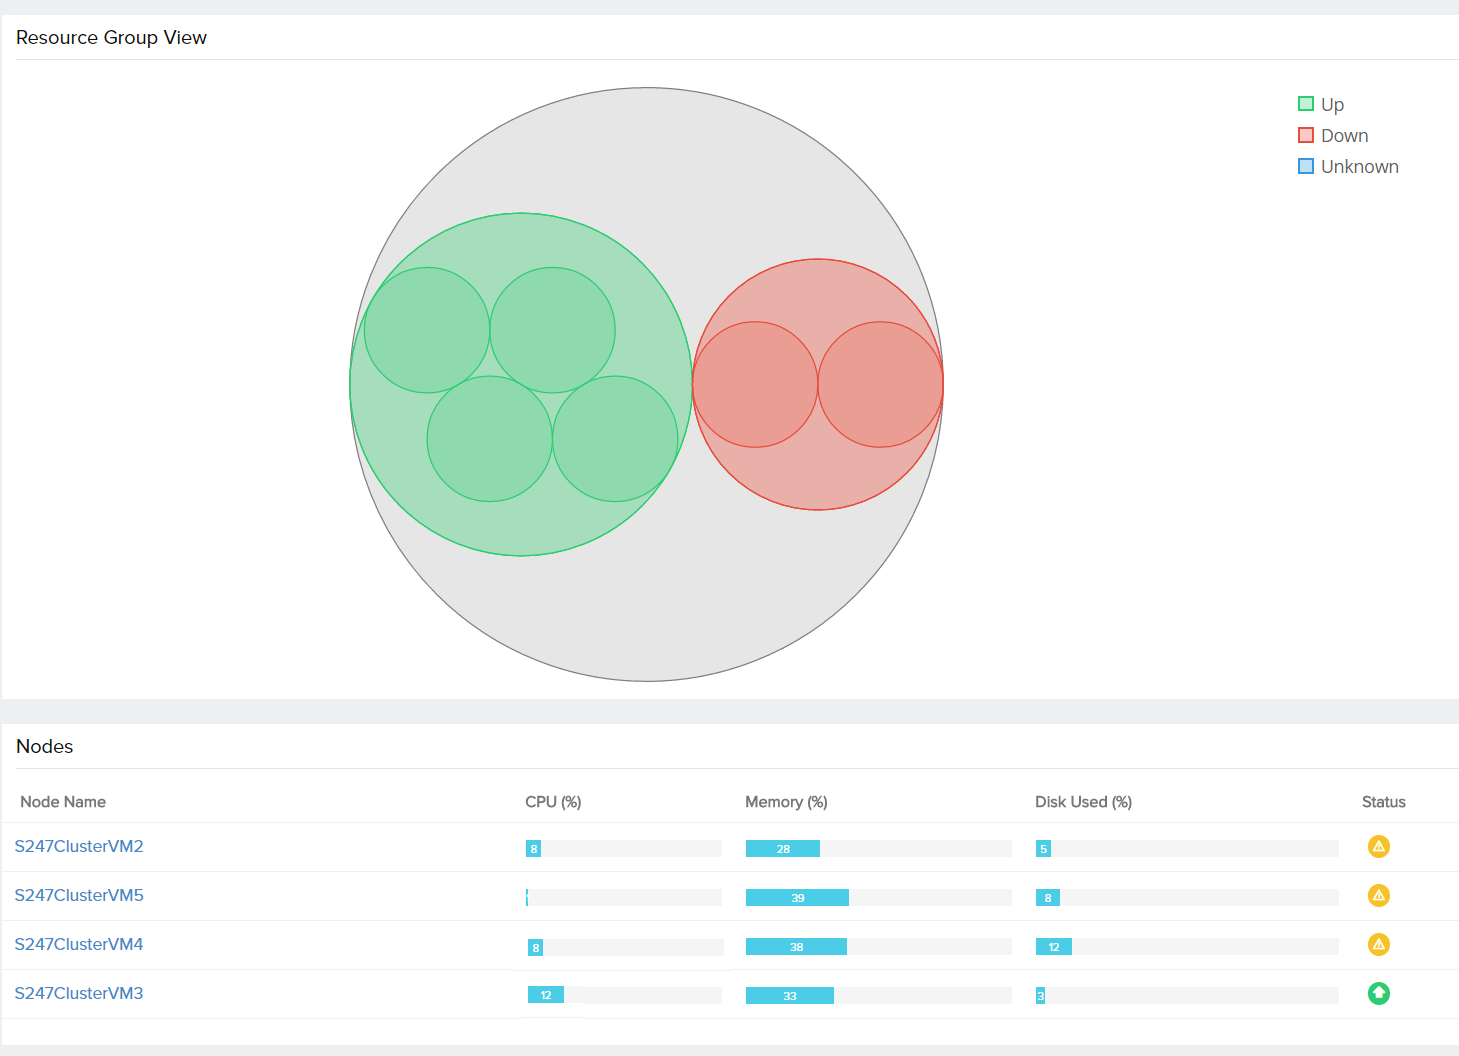
- Cluster View: Details on the number of nodes, networks, online and offline resource groups are listed.
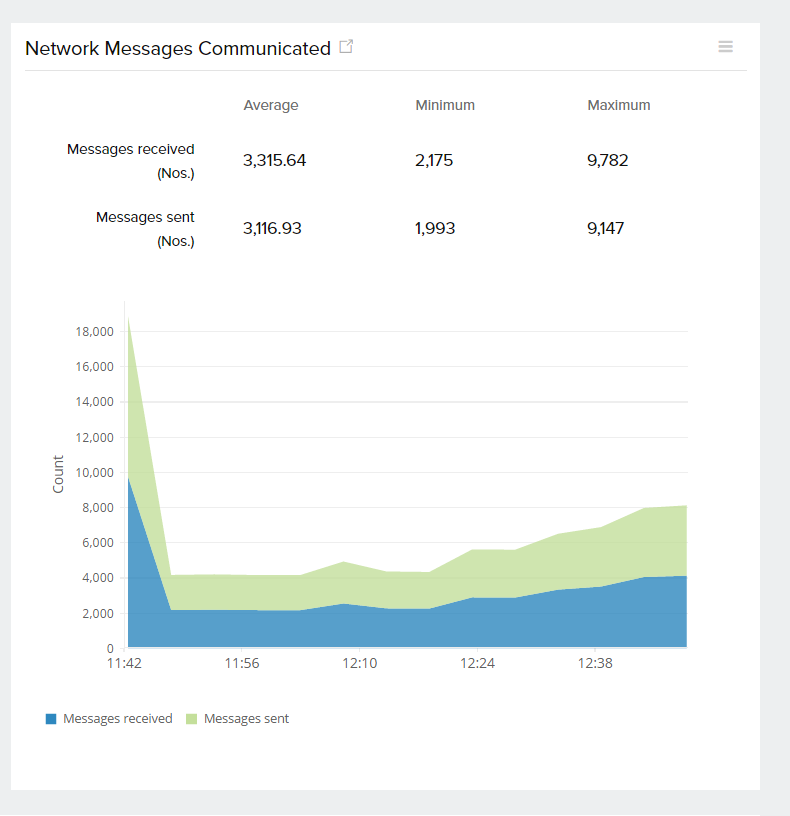
- Performance: Metrics related to resource stats and network messages communicated.
- Networks: Name, address, status of the network, along with bytes received/sent per second are specified.
- Storage: Data on the cluster disk including free space, used space, and total space available are tabulated.
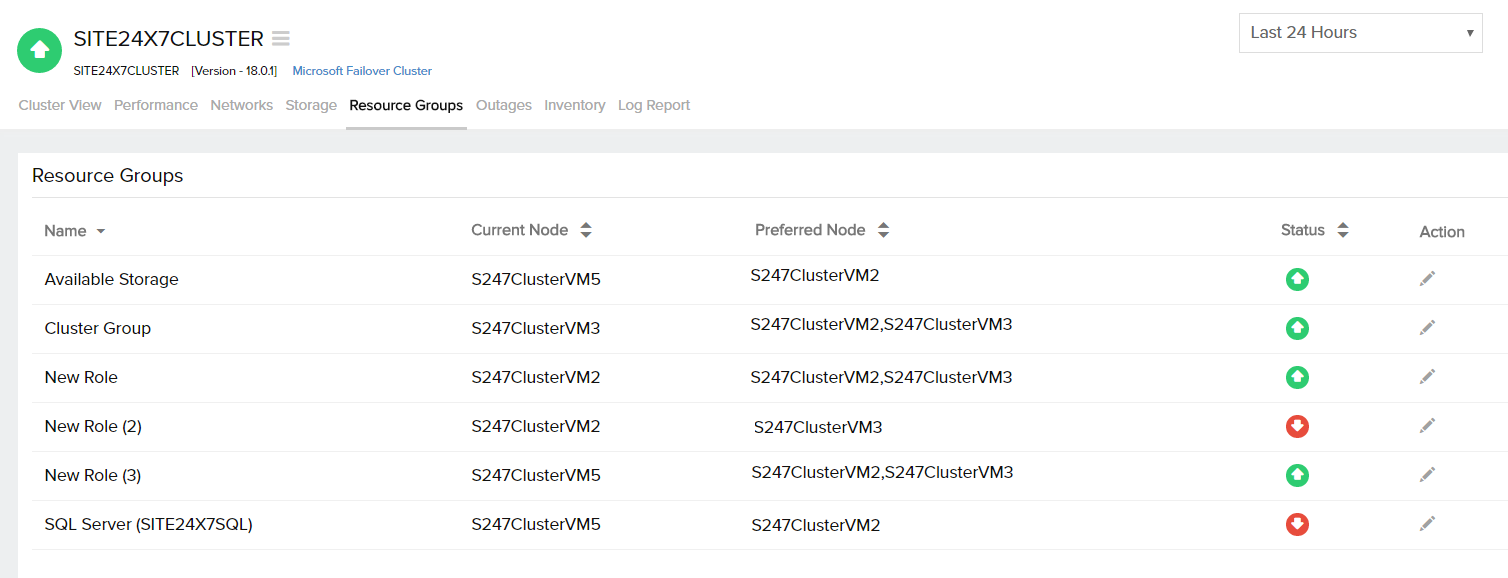
- Resource Groups: Name, status, and the nodes in which the resource group is running are given.
Cluster View
| Parameters | Description |
| Cluster View | A global status view for all nodes in a failover cluster |
| Nodes: | |
| Node Name | Name of the node |
| CPU (%) | CPU utilized by the node |
| Memory (%) | Amount of memory utilized by the node |
| Disk Used (%) | Amount of disk utilized by the node |
| Status | The current status of the node is declared as UP or DOWN |
| Cluster Details: | |
| Number of Nodes | The total number of nodes in a cluster |
| Maximum Number of Nodes | The maximum number of nodes that can participate in a cluster |
| Number of Networks | The number of networks used by the server cluster for communication |
| Disks in Use | The number of disks currently in use in the cluster |
| Quorum Path | The path to the quorum files |
| Quorum Type | The current quorum type |
| Resources Online | The count of resources that are currently online |
| Resources Offline | The count of resources that are currently offline |
| Resource Groups Online | The count of resource groups that are currently online |
| Resource Groups Offline | The count of resource groups that are currently offline |
| Nodes: | |
| Name | Gives the label by which the node is known |
| Timer Service | Status of the 'Windows time' service |
| Status | Tells us the current status of the node. The node state can be up, down, joining, paused, and unknown |

Performance
| Parameters | Description |
| Multicast Request Reply | Communication primitive in the cluster, that allows nodes to send a call to multiple recipients and then get response from all of them |
| Resource Control Manager | A component used in the cluster to manage the resources |
| Network Bytes Used | Cluster network bytes sent and received |
| Network Messages Communicated | Cluster network messages sent and received |
| Network Reconnections: | |
| Normal Messages Queue Length | Specifies the number of messages in the queue waiting to be sent |
| Normal Messages Queue Length Delta | Specifies the incoming message rate to the queue |
| Urgent Message Queue Length | Specifies the number of urgent messages in the queue waiting to be sent |
| Urgent Message Queue Length Delta | Specifies the incoming message rate to the queue |
| Reconnect Count | Specifies the number of times the TCP connection was broken and reestablished |
| Resource Type Stats: | |
| Resource Type | Type of the resource |
| Resource Failure | The number of times the Resource Host Subsystem gets terminated due to a resource failure |
| Resource Failure Access Violation | Indicates the number of times the Resource Host Subsystem gets terminated due to a resource failure, caused by access violation |
| Resource Failure Deadlock | Indicates the number of times the Resource Host Subsystem gets terminated due to a resource failure, caused by a deadlock |

Networks
| Parameters | Description |
| Networks: | |
| Name | Name of the network |
| Address | Gives the address for the entire network or subnet |
| Role | Specifies the role of the network in the cluster |
| Status | Tells us the current state of the network |
| Nodes: | |
| Name | Name of the node |
| Bytes Received (MB) | The number of new cluster message bytes received on the network per second |
| Bytes Sent (MB) | The number of new cluster message bytes sent over the network per second |
| Messages Received | The number of new cluster messages received on the network per second |
| Messages Sent | The number of new cluster messages sent over the network per second |
Storage
| Parameters | Description |
| Path | The path of the cluster disk |
| Volume Label | Gives information on the volume label of the disk partition |
| Total Size (MB) | The total size of the partition |
| Used (MB) | The total used space in the partition |
| Free (MB) | The total free space available for the partition |
| Used (%) | The percentage of used space in the partition |
| Free (%) | The percentage of free space in the partition |

Resource Groups
| Parameters | Description |
| Resource Group View | A global status view for all the resource groups in a failover cluster |
| Name | The name of the Resource Group |
| Current Node | The node in which the resource group is currently running |
| Preferred Node | Gives the preferred node names in the cluster, to which the resource can failover/failback |
| Status | The current status of the resource group |

Performance Reports for Failover Cluster
Log in to Site24x7 and go to Reports > Microsoft Failover Cluster. The following reports are available for cluster monitoring:
- Availability Summary Report
- Busy Hours Report
- Health Trend Report
- Performance Report
- Cluster Node Status Report
