Monitor Azure Log Analytics Workspace
Azure Log Analytics workspaces gather data from multiple sources, but without effective monitoring, there can be gaps in log data, affecting the overall system's reliability and performance.
Implementing robust monitoring ensures complete data ingestion and optimal performance of the Log Analytics workspace, preventing any disruptions or data loss. With Site24x7's integration, you can monitor your workspaces with accurate metrics, configure thresholds, and get instant alerts if there is a breach.
Setup and configuration
Adding Azure Log Analytics Workspace while configuring a new Azure monitor
If you haven't configured an Azure monitor yet, or if you're setting it up for the first time, follow the steps below to add an Azure monitor along with your Azure Log Analytics Workspace:
- Log in to your Site24x7 account.
- Choose Cloud from the left navigation pane, and select Azure > Add Azure Monitor. You can also follow these steps to add an Azure monitor.
- During Azure monitor configuration, on the Add Azure Monitor page, select Azure Log Analytics Workspace along with other required resource types from the Service/Resource Types drop-down. Check if you have configured the corresponding resource groups and tag filters in the Edit page.
Adding Azure Log Analytics Workspace to an existing Azure monitor
If you already have an Azure monitor configured for the tenant, you can add the Azure Log Analytics Workspace using the following steps:
- Log in to your Site24x7 account.
- Navigate to Cloud > Azure and select the Azure monitor from the left pane for which you wish to add Azure Log Analytics Workspace.
- On the Service View page, click the Enable Monitoring button for the Azure Log Analytics Workspace service type. Check if you have configured the corresponding resource groups and tag filters in the Edit page.
It will take 15-30 minutes to discover new Azure resources. To immediately discover the selected configuration, click Discover Now in the top-right corner, and all the resources that match the filters configured on the Azure Edit page will be discovered even if the Auto-Discover New Resources option is disabled.
Now you can view the discovered resources from the Service View dashboard itself.
Polling frequency
Site24x7's Azure Log Analytics Workspace monitor collects metric data every minute and the statuses from your applications every five minutes.
Supported metrics
Performance
| Metric | Description | Statistic | Unit |
|---|---|---|---|
| Bytes Exported (preview) | The total number of bytes exported per the specified data export rule to the specified destination from this workspace | Total | Bytes |
| Records Exported (preview) | The total number of records exported per the specified data export rule to the specified destination from this workspace |
Total | Count |
| Exports Failed (preview) | The total number of data exports failed per the specified data export rule to the specified destination from this workspace | Total | Count |
| Availability Rate Query | The average user query success rate for this workspace |
Average | Percent |
| Ingestion Time | The time taken since the record received in Azure Monitor Logs cloud service until it was available for queries | Average | Seconds |
| Ingestion Volume | The number of records ingested into a workspace or a table. | Count | Count |
| Query Count | The total number of user queries for this workspace | Count | Count |
| Query Failure Count | The total number of failed user queries for this workspace | Count | Count |
Azure Uptime monitoring
Site24x7’s Azure Uptime monitoring enables proactive tracking of your Azure resources’ availability and uptime, along with their configuration and inventory details. Note that uptime monitoring will disable performance metric data collection.
Threshold configuration
Associating a threshold profile can be done from the monitor's Edit page:
- Under Configuration Profiles > Threshold and Availability > select the corresponding threshold profile from the drop-down.
The changes made to this threshold profile will be applied to all the associated monitors. You can either add or edit a threshold profile by clicking the + or pencil icon, respectively.
Bulk Action
Bulk association of threshold profiles can be done from the Admin page (Admin > Inventory > Bulk Action > under Monitor Configuration, go to Modify Threshold Profile).
You can set threshold values for the metrics by selecting the Threshold and Availability option. You can also configure IT automation at the attribute level.
Default thresholds
Site24x7 alerts you based on a set of default thresholds. These default thresholds ensure that your service capacity is not overutilized, thus maintaining optimal storage and performance and reduced costs.
These are the default threshold categories:
- Resource Health
- On Change Configuration
- Metrics threshold
Resource Health:
- Alert if Resource Health is Unavailable
- Alert if Resource Health is Unknown
On Change Configuration:
- Alert if Compute Size is Changed
- Alert if Retention in Days is Changed
- Alert if Log Access Using Only Resource Permissions is Changed
- Alert if Daily Quota GB is Changed
- Alert if Public Network Access for Ingestion is Changed
- Alert if Public Network Access for Query is Changed
Metrics threshold:
-
Exports Failed
-
Query Failure Count
IT automation
Site24x7 offers a set of exclusive IT automation tools to auto-resolve performance degradation issues. These tools react to events proactively rather than waiting for manual intervention.
How to configure IT automation for a monitor
Configuration Rules
With Site24x7's Configuration Rules, you can set parameters like Threshold Profile, Notification Profile, Tags, and Monitor Group for multiple monitors. These rules can be configured and run for the existing or new monitors (during addition) matching the given criteria.
How to add a configuration rule
Reports
Gain in-depth data about the various parameters of your monitored resources and accentuate your service performance using our insightful reports.
To view reports for Azure Log Analytics Workspace:
- Navigate to the Reports section in the left navigation pane.
- Select Azure Log Analytics Workspace from the menu on the left.
You can find the Availability Summary Report and Performance Report for one selected monitor, or you can get the Inventory Report, Summary Report, Availability Summary Report, Health Trend Report, Log Analytics by Compute Size Report, and Performance Report for all the monitors. Apart from this, you can view the Top N and Bottom N Reports.
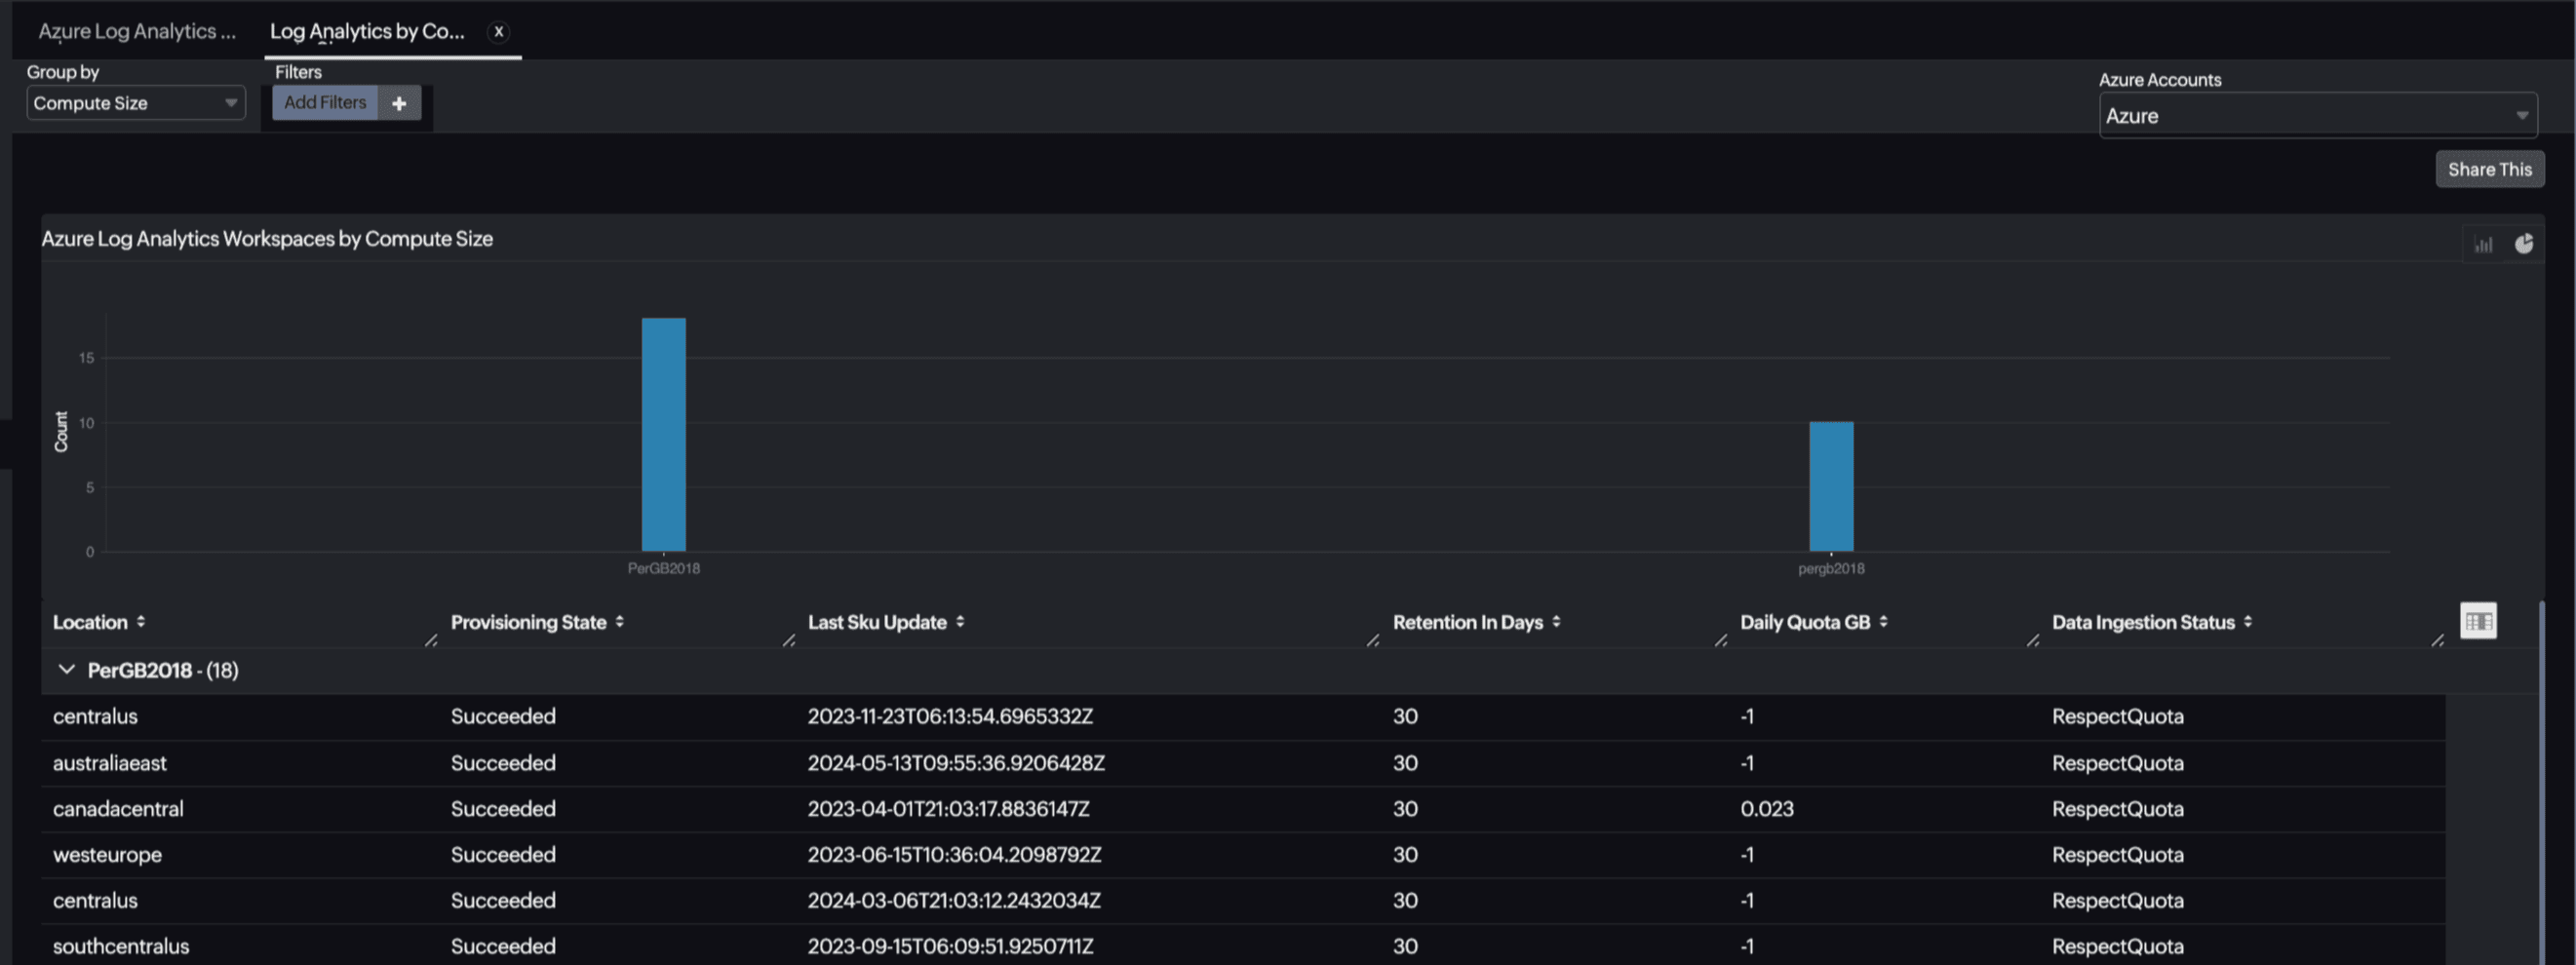
Log Analytics by Compute Size report:
Site24x7's Azure Log Analytics Workspace monitoring also provides a Log Analytics by Compute Size report that will enable you to gain deep insights into your resources.

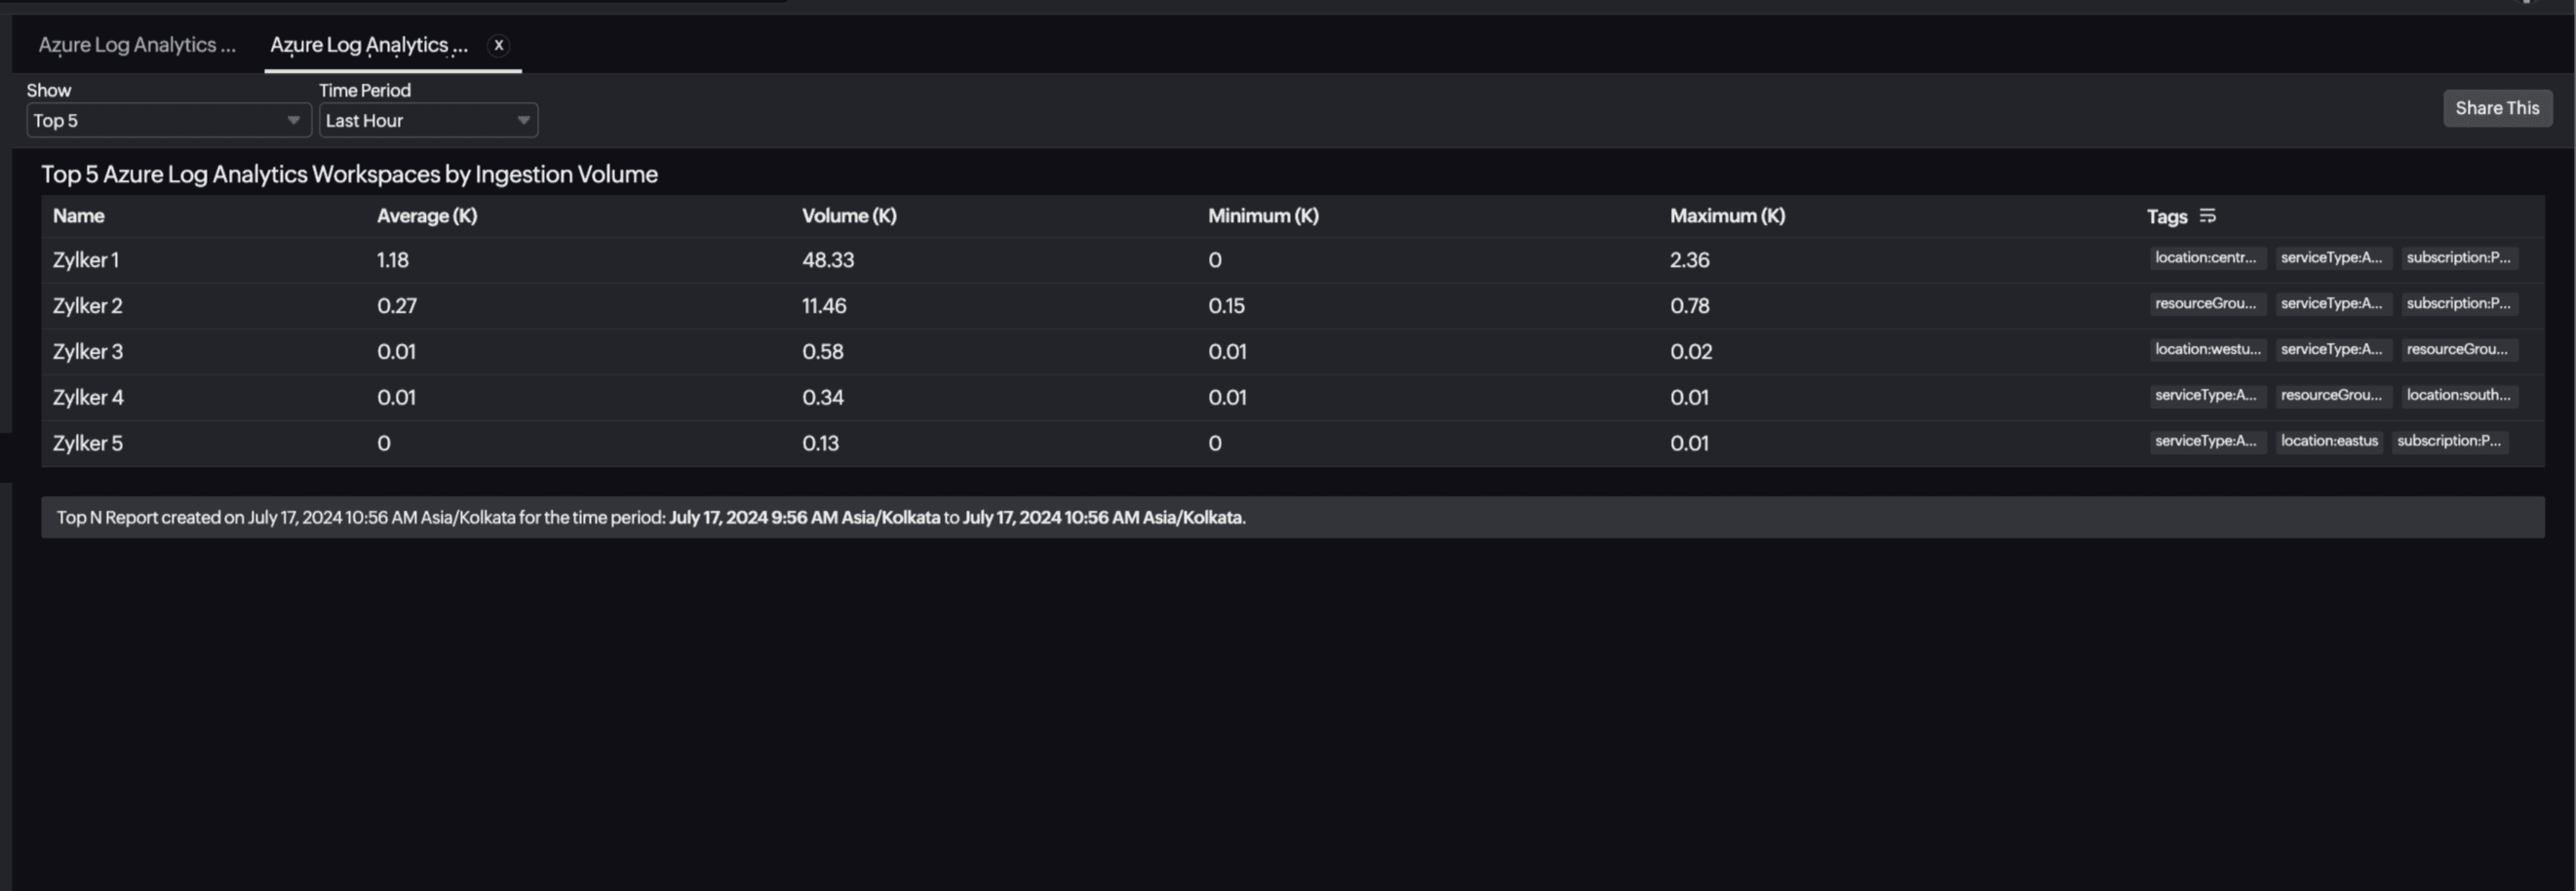
Top N and Bottom N reports
- Azure Log Analytics Workspaces by Query Count
- Azure Log Analytics Workspaces by Ingestion Volume
- Azure Log Analytics Workspaces by Ingestion Time
- Azure Log Analytics Workspaces by Query Failure Count

To schedule a report:
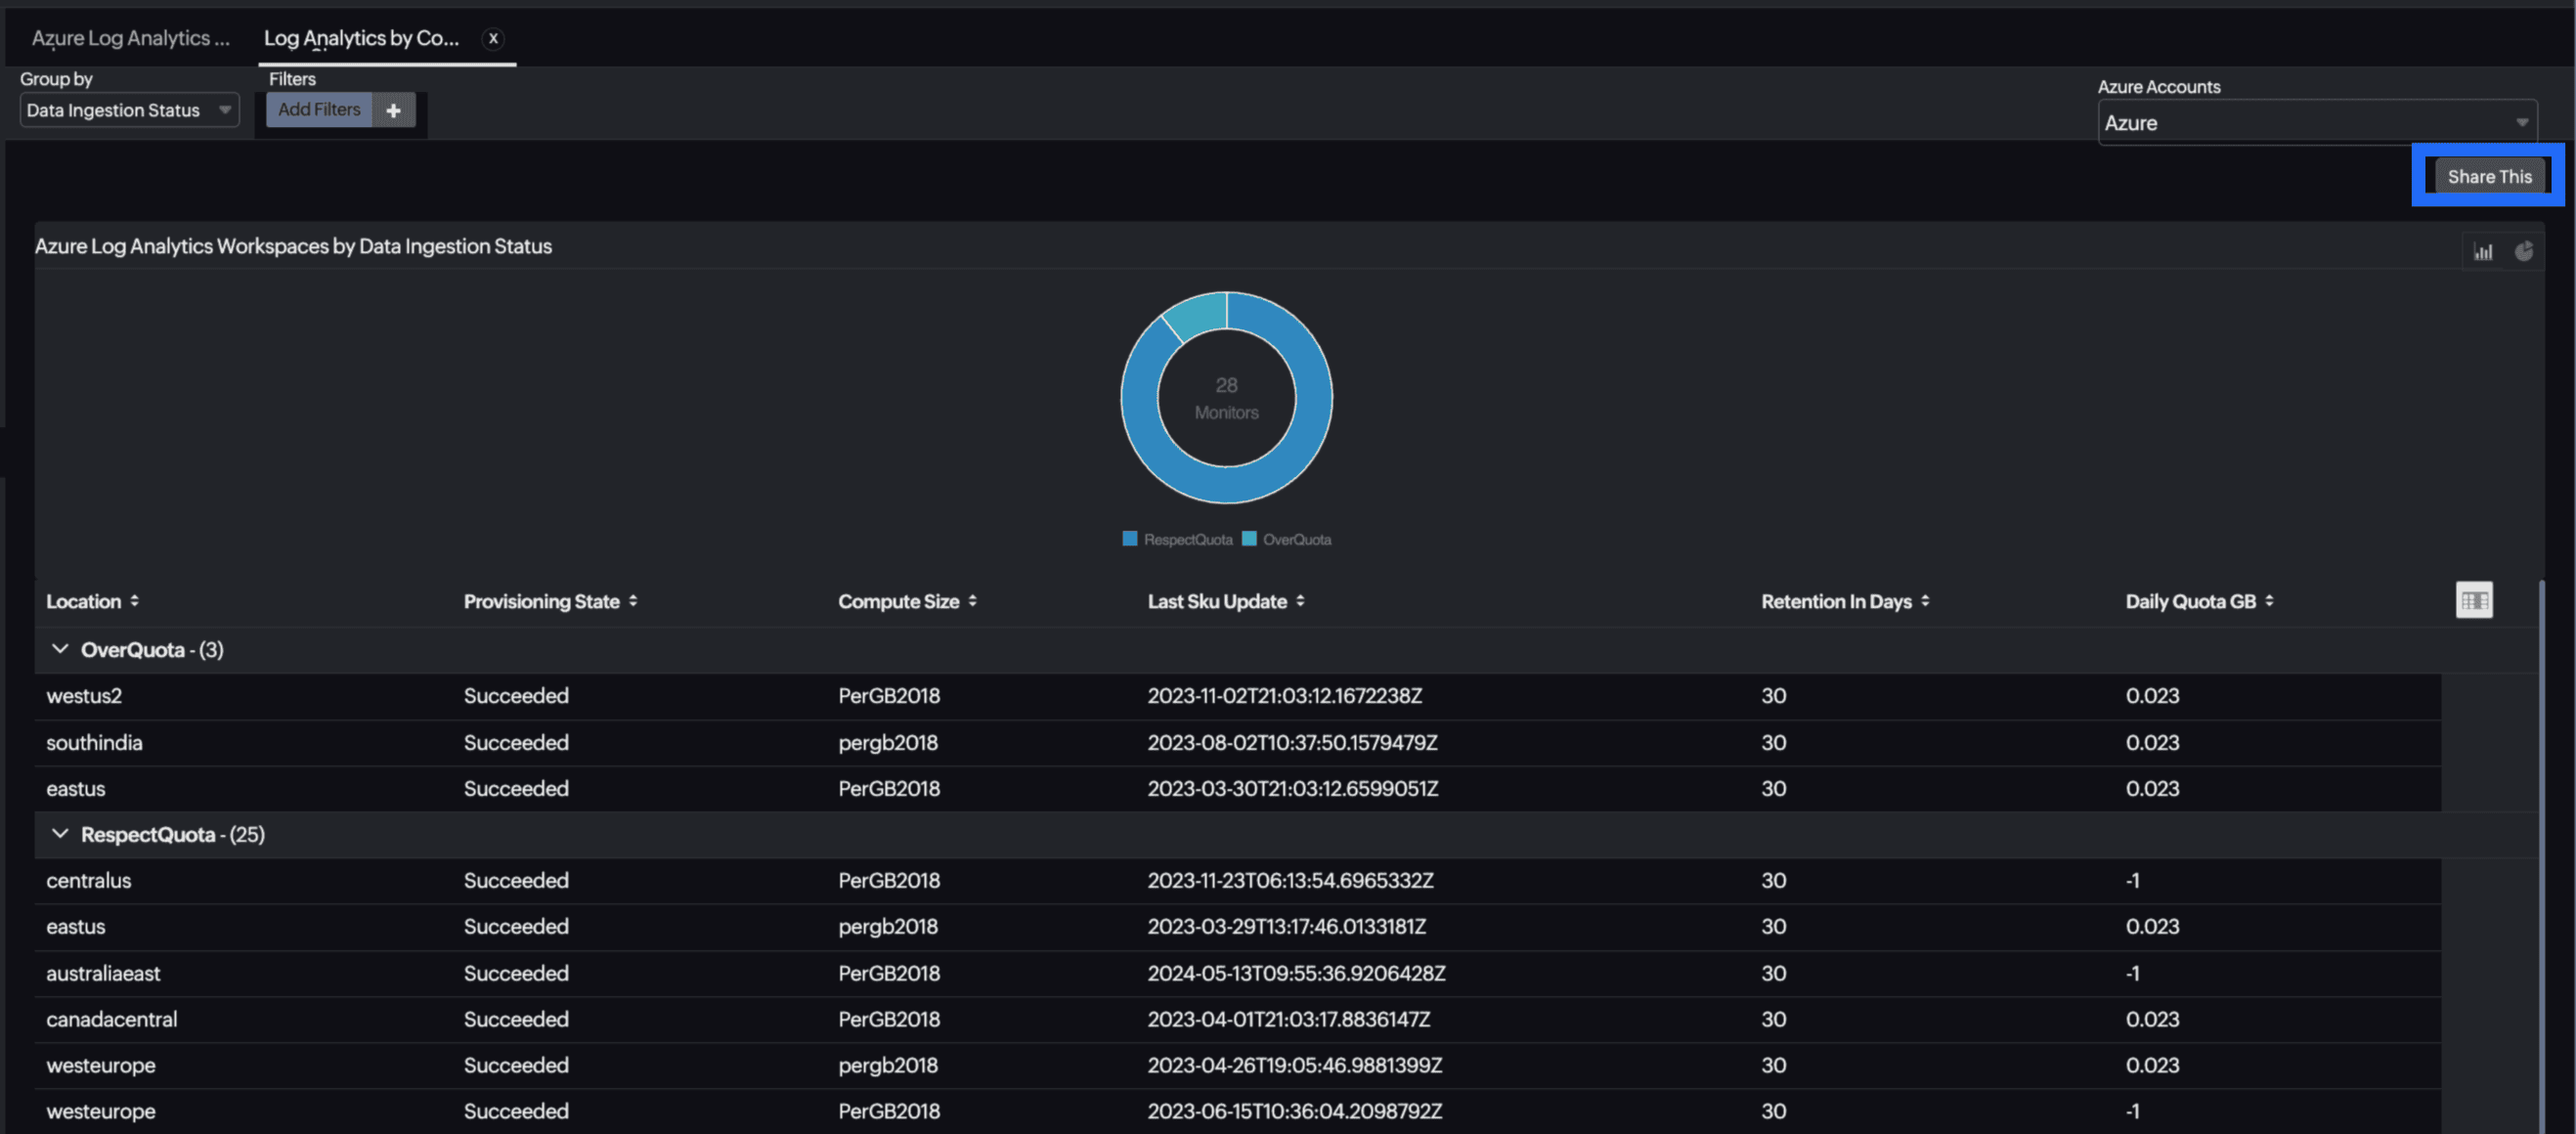
You can schedule the Inventory Report by navigating to Reports > Azure Log Analytics Workspace > Inventory Report and clicking the Share This button at the top-right corner.
In the Schedule Report pop-up, choose the monitor, assign the desired frequency—daily, weekly, monthly, or quarterly—and send regular reports on your inventory details to the groups that you desire.

You can also view the reports from the Performance tab of the Azure Log Analytics Workspace monitor.
- Go to the Performance tab of the Azure Log Analytics Workspace monitor, and get the Availability Summary Report of the monitor by clicking Availability.
- You can also find the Performance Report of the monitor by clicking any chart title.
Site24x7's Log Analytics Workspace monitoring interface
Get an overview of the availability and usage status of your Log Analytics Workspace.
Performance
The Performance tab helps you view the data usage of your resource as well as the availability status of your resource. You can view metrics like Ingestion volume, Ingestion Time, Records Exported, Query Failure Count, and more.
Legacy Log-Based Metrics
With the Legacy Log-Based Metrics tab, you can view the available memory, swap size, free and used size information.
Configuration Details
The Configuration Details tab provides the configuration details of your Log Analytics Workspace. Details on the SQL EndPoint, Public Network Access, Default Consistency Level, Backup Policy Type, Automatic Failover, and more are included in this section.
Zia Forecast
By leveraging the AI-driven Zia framework, you can examine resource consumption measurements through the forecast chart located in the Zia Forecast tab. This chart predicts upcoming performance metrics based on a seven-day historical data analysis, providing insights into the expected metric usage for the next seven days.
Outages
The Outages tab provides the history of the Log Analytics Workspace statuses, including Down, Trouble, and Critical.
Inventory
The Inventory tab provides details on licensing, threshold and availability profiles, the set notification profiles, the set user alert group, and the monitor's created time and modified time.
Log Report
The Log Report tab lists all the logs collected during every data collection along with their statuses.
