Monitor Azure API Management Service
The Azure API Management gateway manages the API life cycle and publishes APIs efficiently. Site24x7 ensures seamless integration and user experience by monitoring the API Management gateway closely.
Tracking API calls with Site24x7 helps manage traffic, plan for scaling, and meet SLAs, ensuring optimal performance and reliability of the API services.
Setup and configuration
Adding the Azure API Management service while configuring a new Azure monitor
If you haven't configured an Azure monitor yet, or if you're setting it up for the first time, follow the steps below to add an Azure monitor along with your Azure API Management service:
- Log in to your Site24x7 account.
- Choose Cloud from the left navigation pane, and select Azure > Add Azure Monitor. You can also follow these steps to add an Azure monitor.
- During Azure monitor configuration, on the Add Azure Monitor page, select Azure API Management Service along with other required resource types from the Service/Resource Types drop-down. Check if you have configured the corresponding resource groups and tag filters in the Edit page.
Adding an Azure API Management service to an existing Azure monitor
If you already have an Azure monitor configured for the tenant, you can add the Azure API Management service using the following steps:
- Log in to your Site24x7 account.
- Navigate to Cloud > Azure and select the Azure monitor from the left pane for which you wish to add Azure API Management Service.
- On the Service View page, click the Enable Monitoring button for the Azure API Management Service service type. Check if you have configured the corresponding resource groups and tag filters in the Edit page.
It will take 15-30 minutes to discover new Azure resources. To immediately discover the selected configuration, click Discover Now in the top-right corner, and all the resources that match the filters configured on the Azure Edit page will be discovered even if the Auto-Discover New Resources option is disabled.
Now you can view the discovered resources from the Service View dashboard itself.
Polling frequency
Site24x7's Azure API Management Service monitor collects metric data every minute and the statuses from your applications every five minutes.
Supported metrics
| Metric name | Description | Statistic | Unit |
|---|---|---|---|
| Duration of Backend Requests | The duration of backend requests | Average | Milliseconds |
| Capacity | This is the utilization metric for ApiManagement service. Note: For skus other than Premium, the 'Max' aggregation will show the value as 0. | Average | Percent |
| WebSocket Connection Attempts (Preview) | The number of WebSocket connection attempts based on the selected source and destination | Total | Count |
| Overall Duration of Gateway Requests | The overall duration of gateway requests | Average | Milliseconds |
| Failed Gateway Requests (Deprecated) | The number of failures in gateway requests | Total | Count |
| Network Connectivity Status of Resources (Preview) | The network connectivity status of the dependent resource types from the API Management service | Average | Count |
| Other Gateway Requests (Deprecated) | The total number of other gateway requests | Total | Count |
| Requests | The total number of gateway request metrics with multiple dimensions | Total | Count |
| Successful Gateway Requests (Deprecated) | The total number of successful gateway requests | Total | Count |
| Total Gateway Requests (Deprecated) | The total number of gateway requests | Total | Count |
| Unauthorized Gateway Requests (Deprecated) | The total number of unauthorized gateway requests | Total | Count |
| WebSocket Messages (Preview) | The total number of WebSocket messages based on the selected source and destination | Total | Count |
EventHubs
| Metric name | Description | Statistic | Unit |
|---|---|---|---|
| Dropped EventHub Events | The number of events skipped because the queue size limit has reached | Total | Count |
| Rejected EventHub Events | The total number of rejected EventHub events due to wrong configuration or unauthorized configuration | Total | Count |
| Successful EventHub Events | The total number of successful EventHub events | Total | Count |
| Throttled EventHub Events | The total number of throttled EventHub events | Total | Count |
| Timed Out EventHub Events | The total number of timed out EventHub events | Total | Count |
| Size of EventHub Events | The total size of EventHub events | Total | Bytes |
| Total EventHub Events | The total number of events sent to EventHub | Total | Count |
| Failed EventHub Events | The total number of failed EventHub events | Total | Count |
Threshold configuration
Associating a threshold profile can be done from the monitor's Edit page:
- Under Configuration Profiles > Threshold and Availability > select the corresponding threshold profile from the drop-down.
The changes made to this threshold profile will be applied to all the associated monitors. You can either add or edit a threshold profile by clicking the + or pencil icon, respectively.
Bulk Action
Bulk association of threshold profiles can be done from the Admin page (Admin > Inventory > Bulk Action > under Monitor Configuration, go to Modify Threshold Profile).
You can set threshold values for the metrics by selecting the Threshold and Availability option. You can also configure IT automation at the attribute level.
Default thresholds
Site24x7 alerts you based on a set of default thresholds. These default thresholds ensure that your service capacity is not overutilized, thus maintaining optimal storage and performance and reducing costs.
These are the default threshold categories:
- Resource Health
- On Change Configuration
- Metrics threshold
Resource Health:
- Alert if Resource Health is Unavailable
On Change Configuration:
- Alert if Gateway Status is Changed
- Alert if Public Network Access is Changed
- Alert if Compute Size is Changed
- Alert if Capacity is Changed
Metrics threshold:
- Capacity
IT automation
Site24x7 offers a set of exclusive IT automation tools to auto-resolve performance degradation issues. These tools react to events proactively rather than waiting for manual intervention.
How to configure IT automation for a monitor
Configuration Rules
With Site24x7's Configuration Rules, you can set parameters like Threshold Profile, Notification Profile, Tags, and Monitor Group for multiple monitors. These rules can be configured and run for the existing or new monitors (during addition) matching the given criteria.
How to add a configuration rule
Reports
Gain in-depth data about the various parameters of your monitored resources and accentuate your service performance using our insightful reports.
To view reports for Azure API Management Service:
- Navigate to the Reports section in the left navigation pane.
- Select Azure API Management Service from the menu on the left.
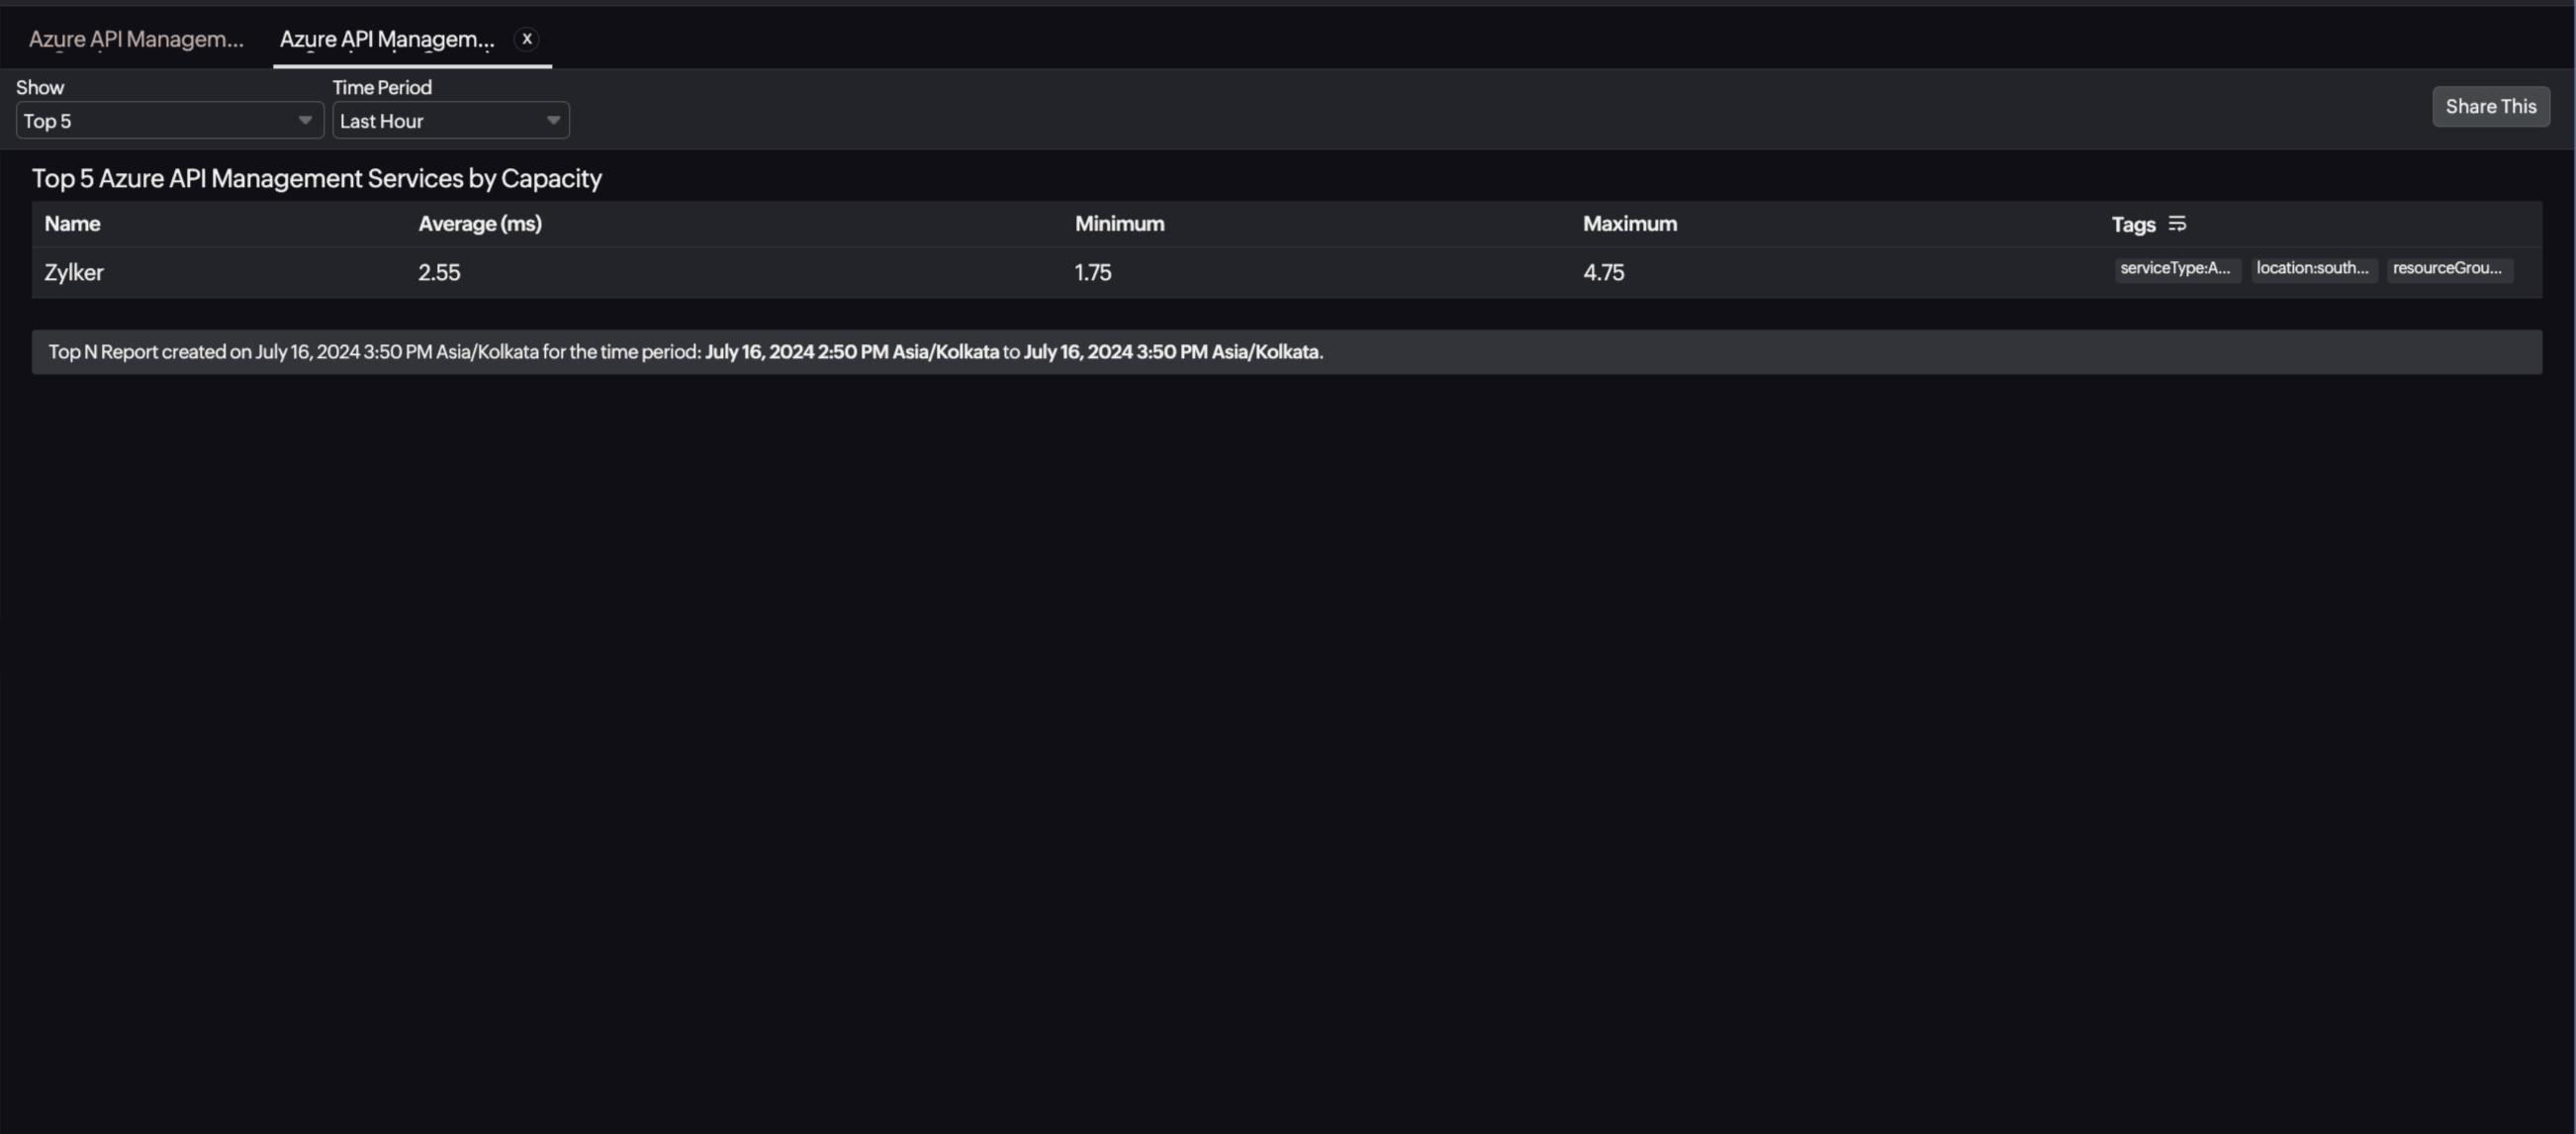
You can find the Availability Summary Report and Performance Report for one selected monitor, or you can get the Inventory Report, Summary Report, Availability Summary Report, Health Trend Report, API Management Service by Compute Size Report, API Management service by Location, and Performance Report for all the monitors. Apart from this, you can view the Top N and Bottom N Reports.
API Management Service by Compute Size report:
Site24x7's Azure API Management Service monitoring also provides a API Management Service by Compute Size report that will enable you to gain deep insights into your resources.
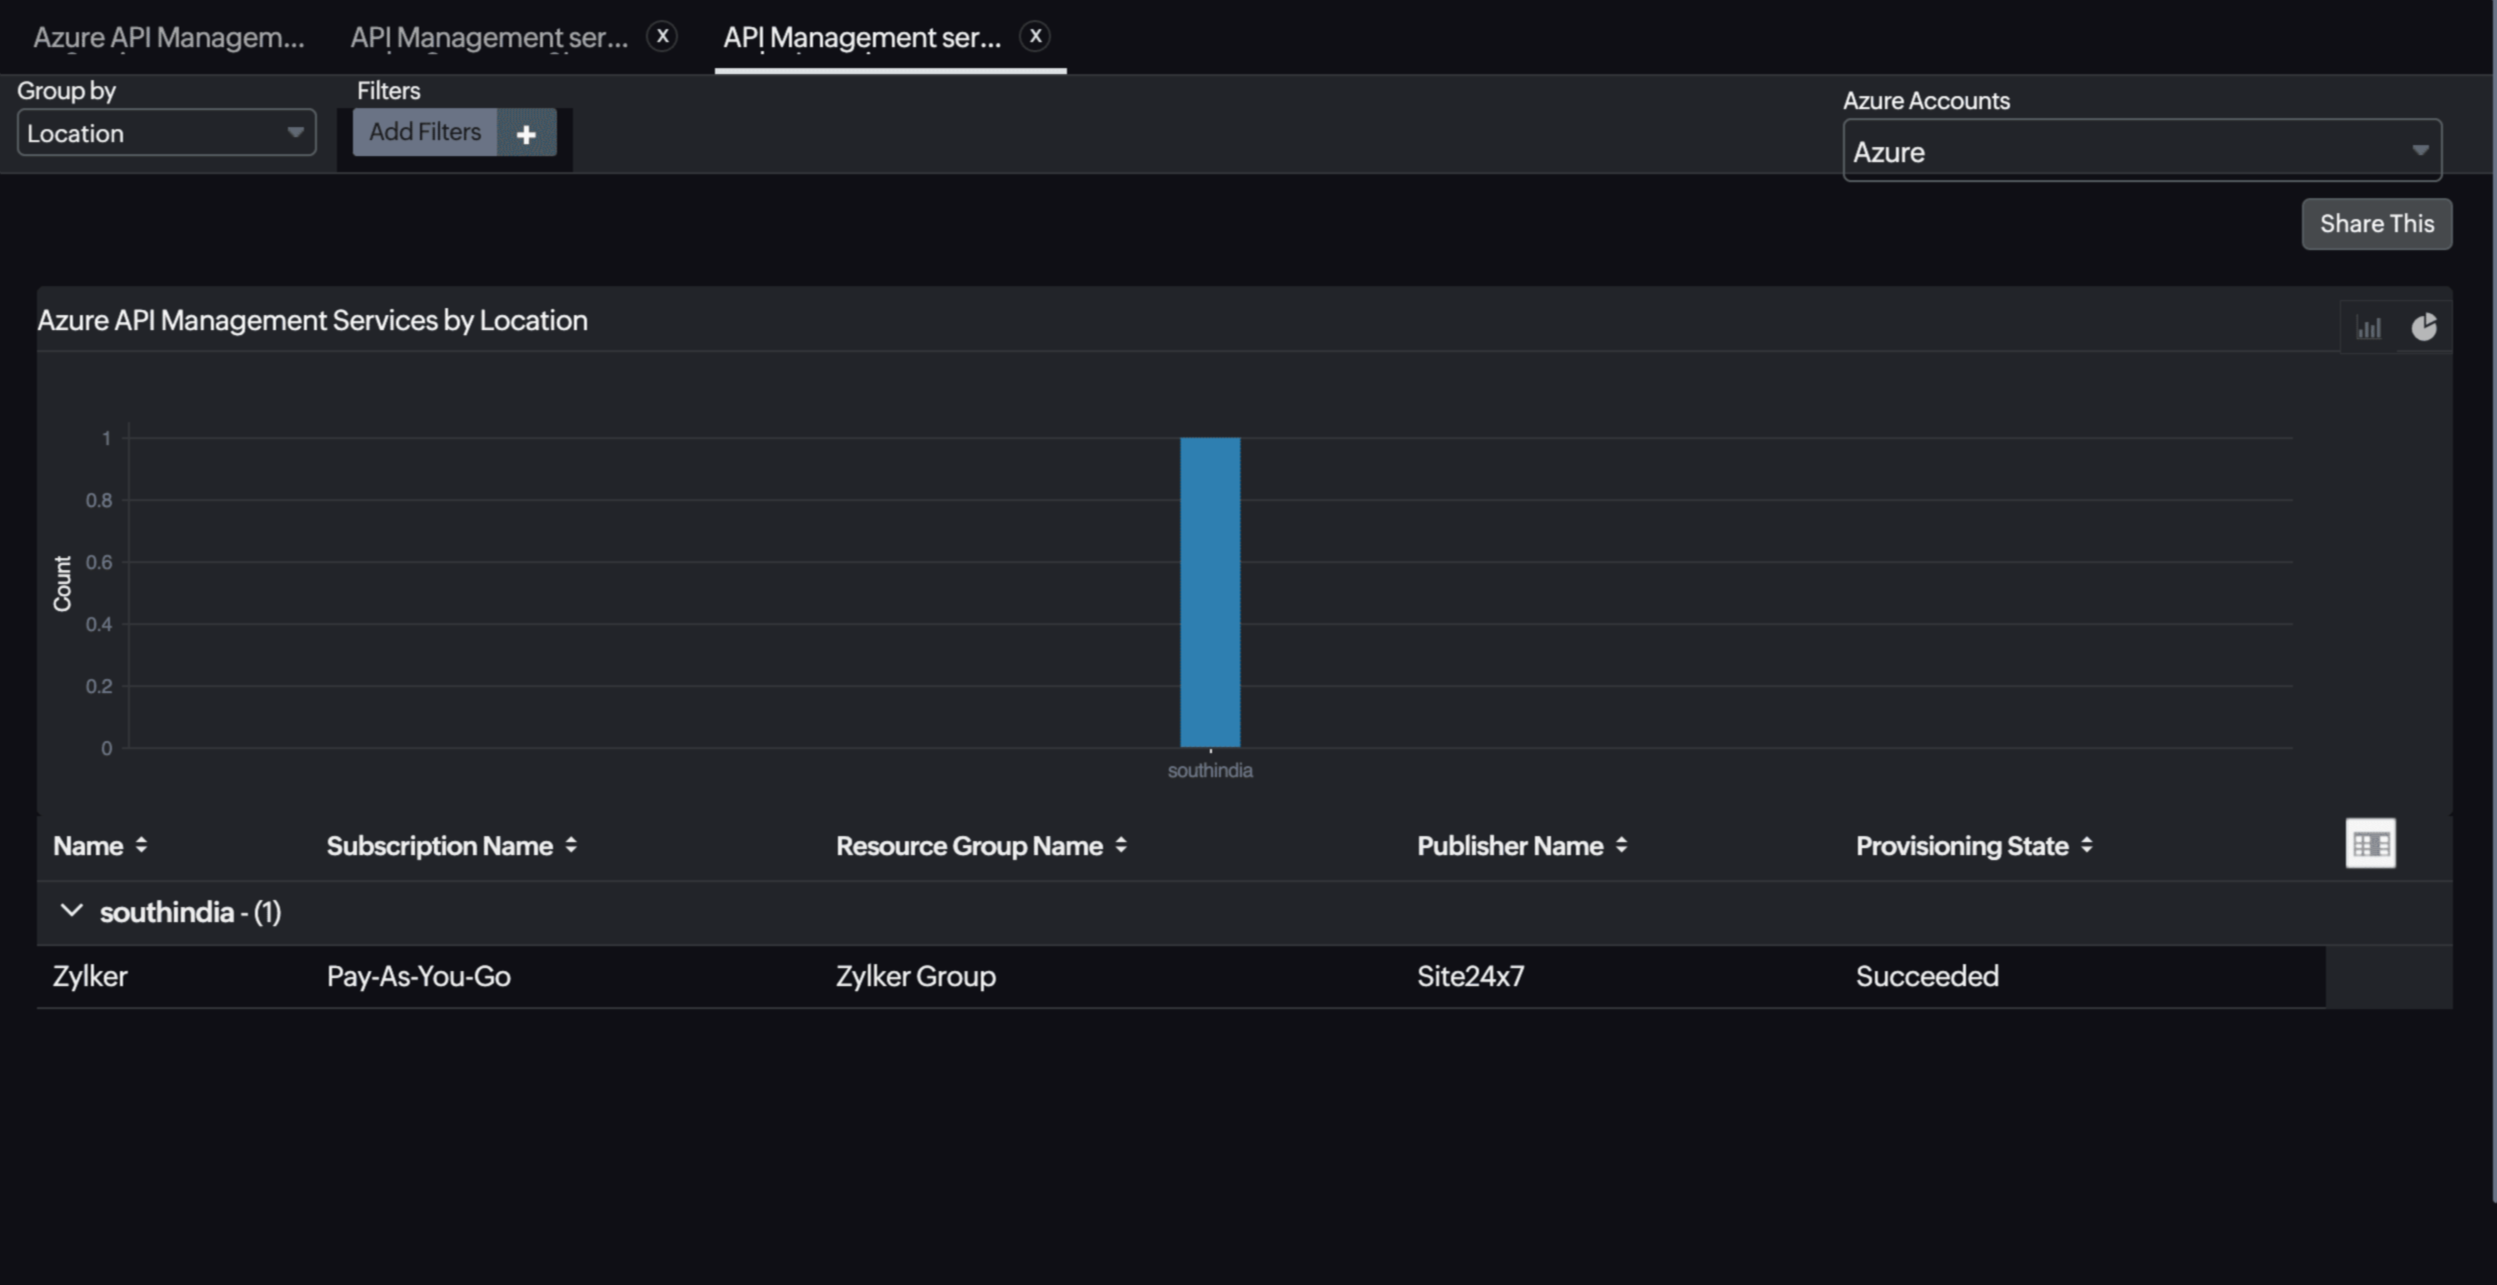
API Management Service by Location
Site24x7 Azure API Management Service monitoring also provides a API Management service by Location report that will help you gain understanding about the location of your resources.
Top N and Bottom N reports
- Azure API Management Services by Total Requests
- Azure API Management Services by Capacity
- Azure API Management Services by Successful Gateway Requests (Deprecated)
- Azure API Management Services by Unauthorized Gateway Requests (Deprecated)
- Azure API Management Services by Failed Gateway Requests (Deprecated)
- Azure API Management Services by Successful Event Hub Events
- Azure API Management Services by Failed Event Hub Events
- Azure API Management Services by Rejected Event Hub Events
- Azure API Management Services by Throttled Event Hub Events
- Azure API Management Services by Timed OutEvent Hub Events
- Azure API Management Services by Dropped Event Hub Events
To schedule a report:
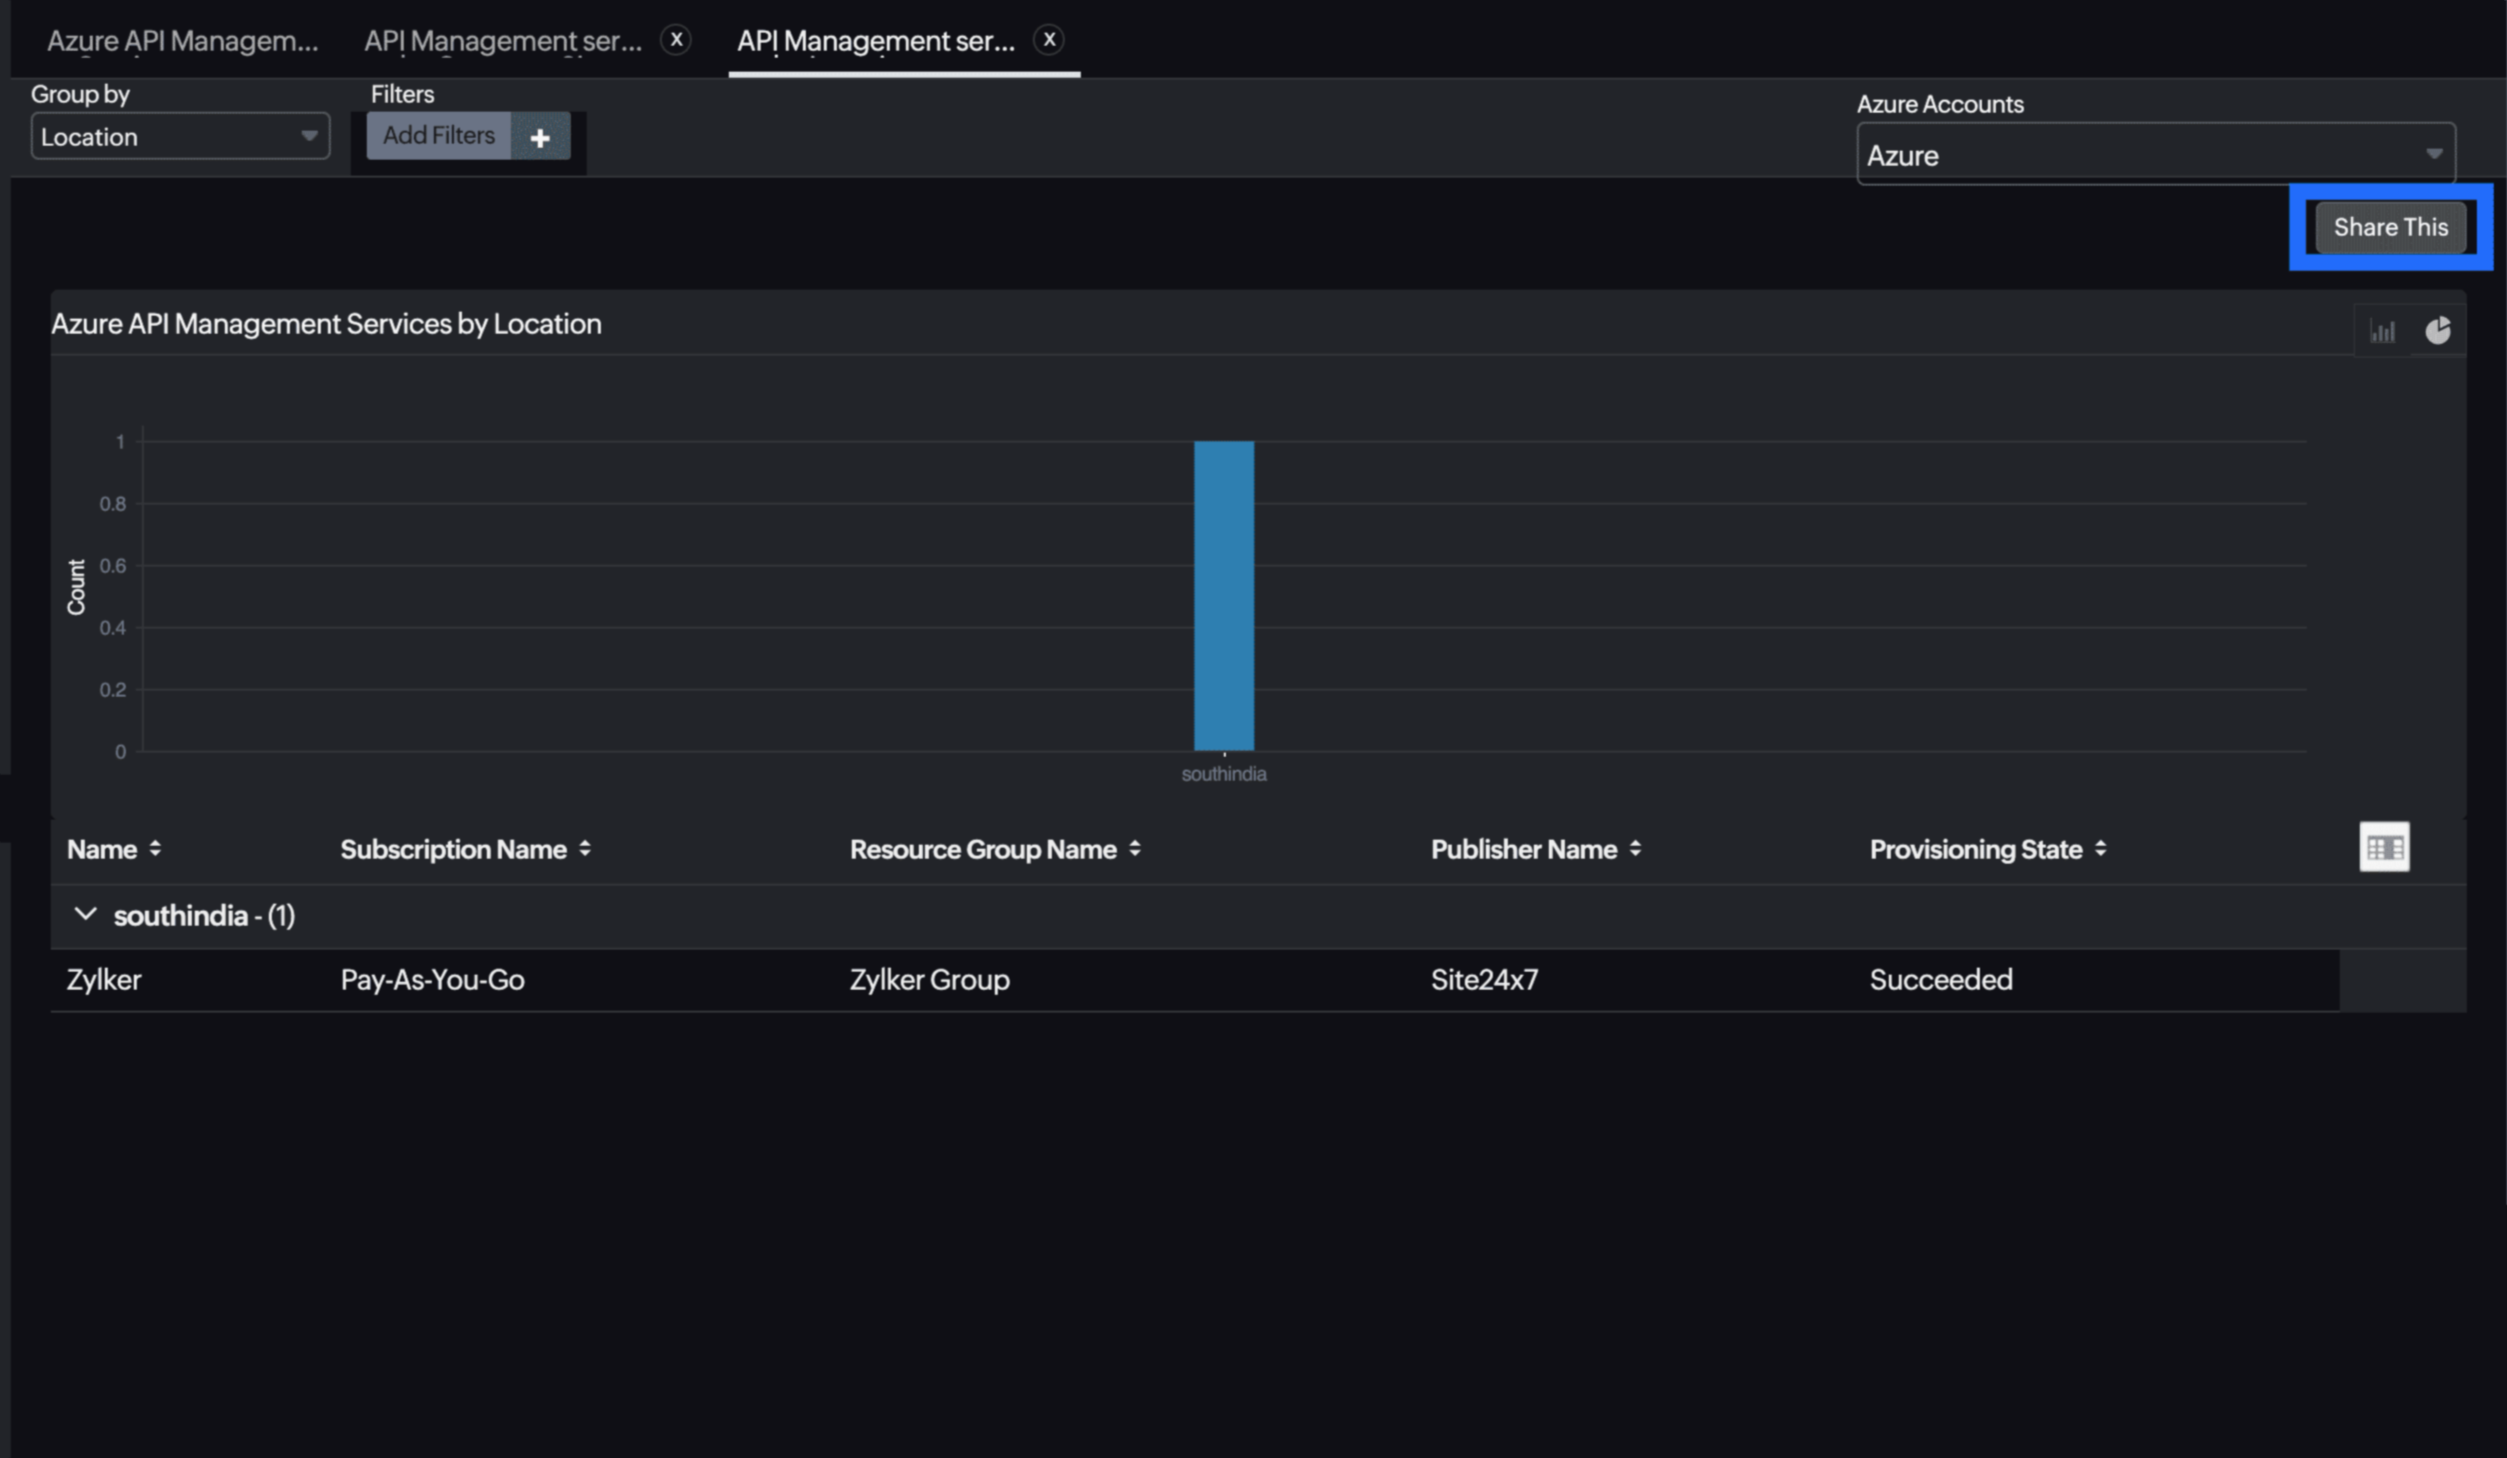
You can schedule the Inventory Report by navigating to Reports > Azure API Management Service > Inventory Report and clicking the Share This button at the top-right corner.
In the Schedule Report pop-up, choose the monitor, assign the desired frequency—daily, weekly, monthly, or quarterly—and send regular reports on your inventory details to the groups that you desire.
You can also view the reports from the Performance tab of the Azure API Management Service monitor.
- Go to the Performance tab of the Azure API Management Service monitor, and get the Availability Summary Report of the monitor by clicking Availability.
- You can also find the Performance Report of the monitor by clicking any chart title.
Site24x7's API Management Service monitoring interface
Get an overview of the availability and usage status of your API Management Service.
Summary
The Summary tab will help you view the capacity of your resource as well as the availability status of your resource. You can view metrics like gateway and backend requests, WebSocket messages and connection attempts, and more.
EventHub Events
The EventHub Events tab contains the information on the total EventHub events, and the number of events that were successful, failed, throttled, timed out, rejected and also the size of the events.
Configuration Details
The Configuration Details tab provides the configuration details of your API Management service. Details on the capacity, status of the NAT Gateway, Public Network Access, and Provisioning, the version of the platform, and more are included in this section.
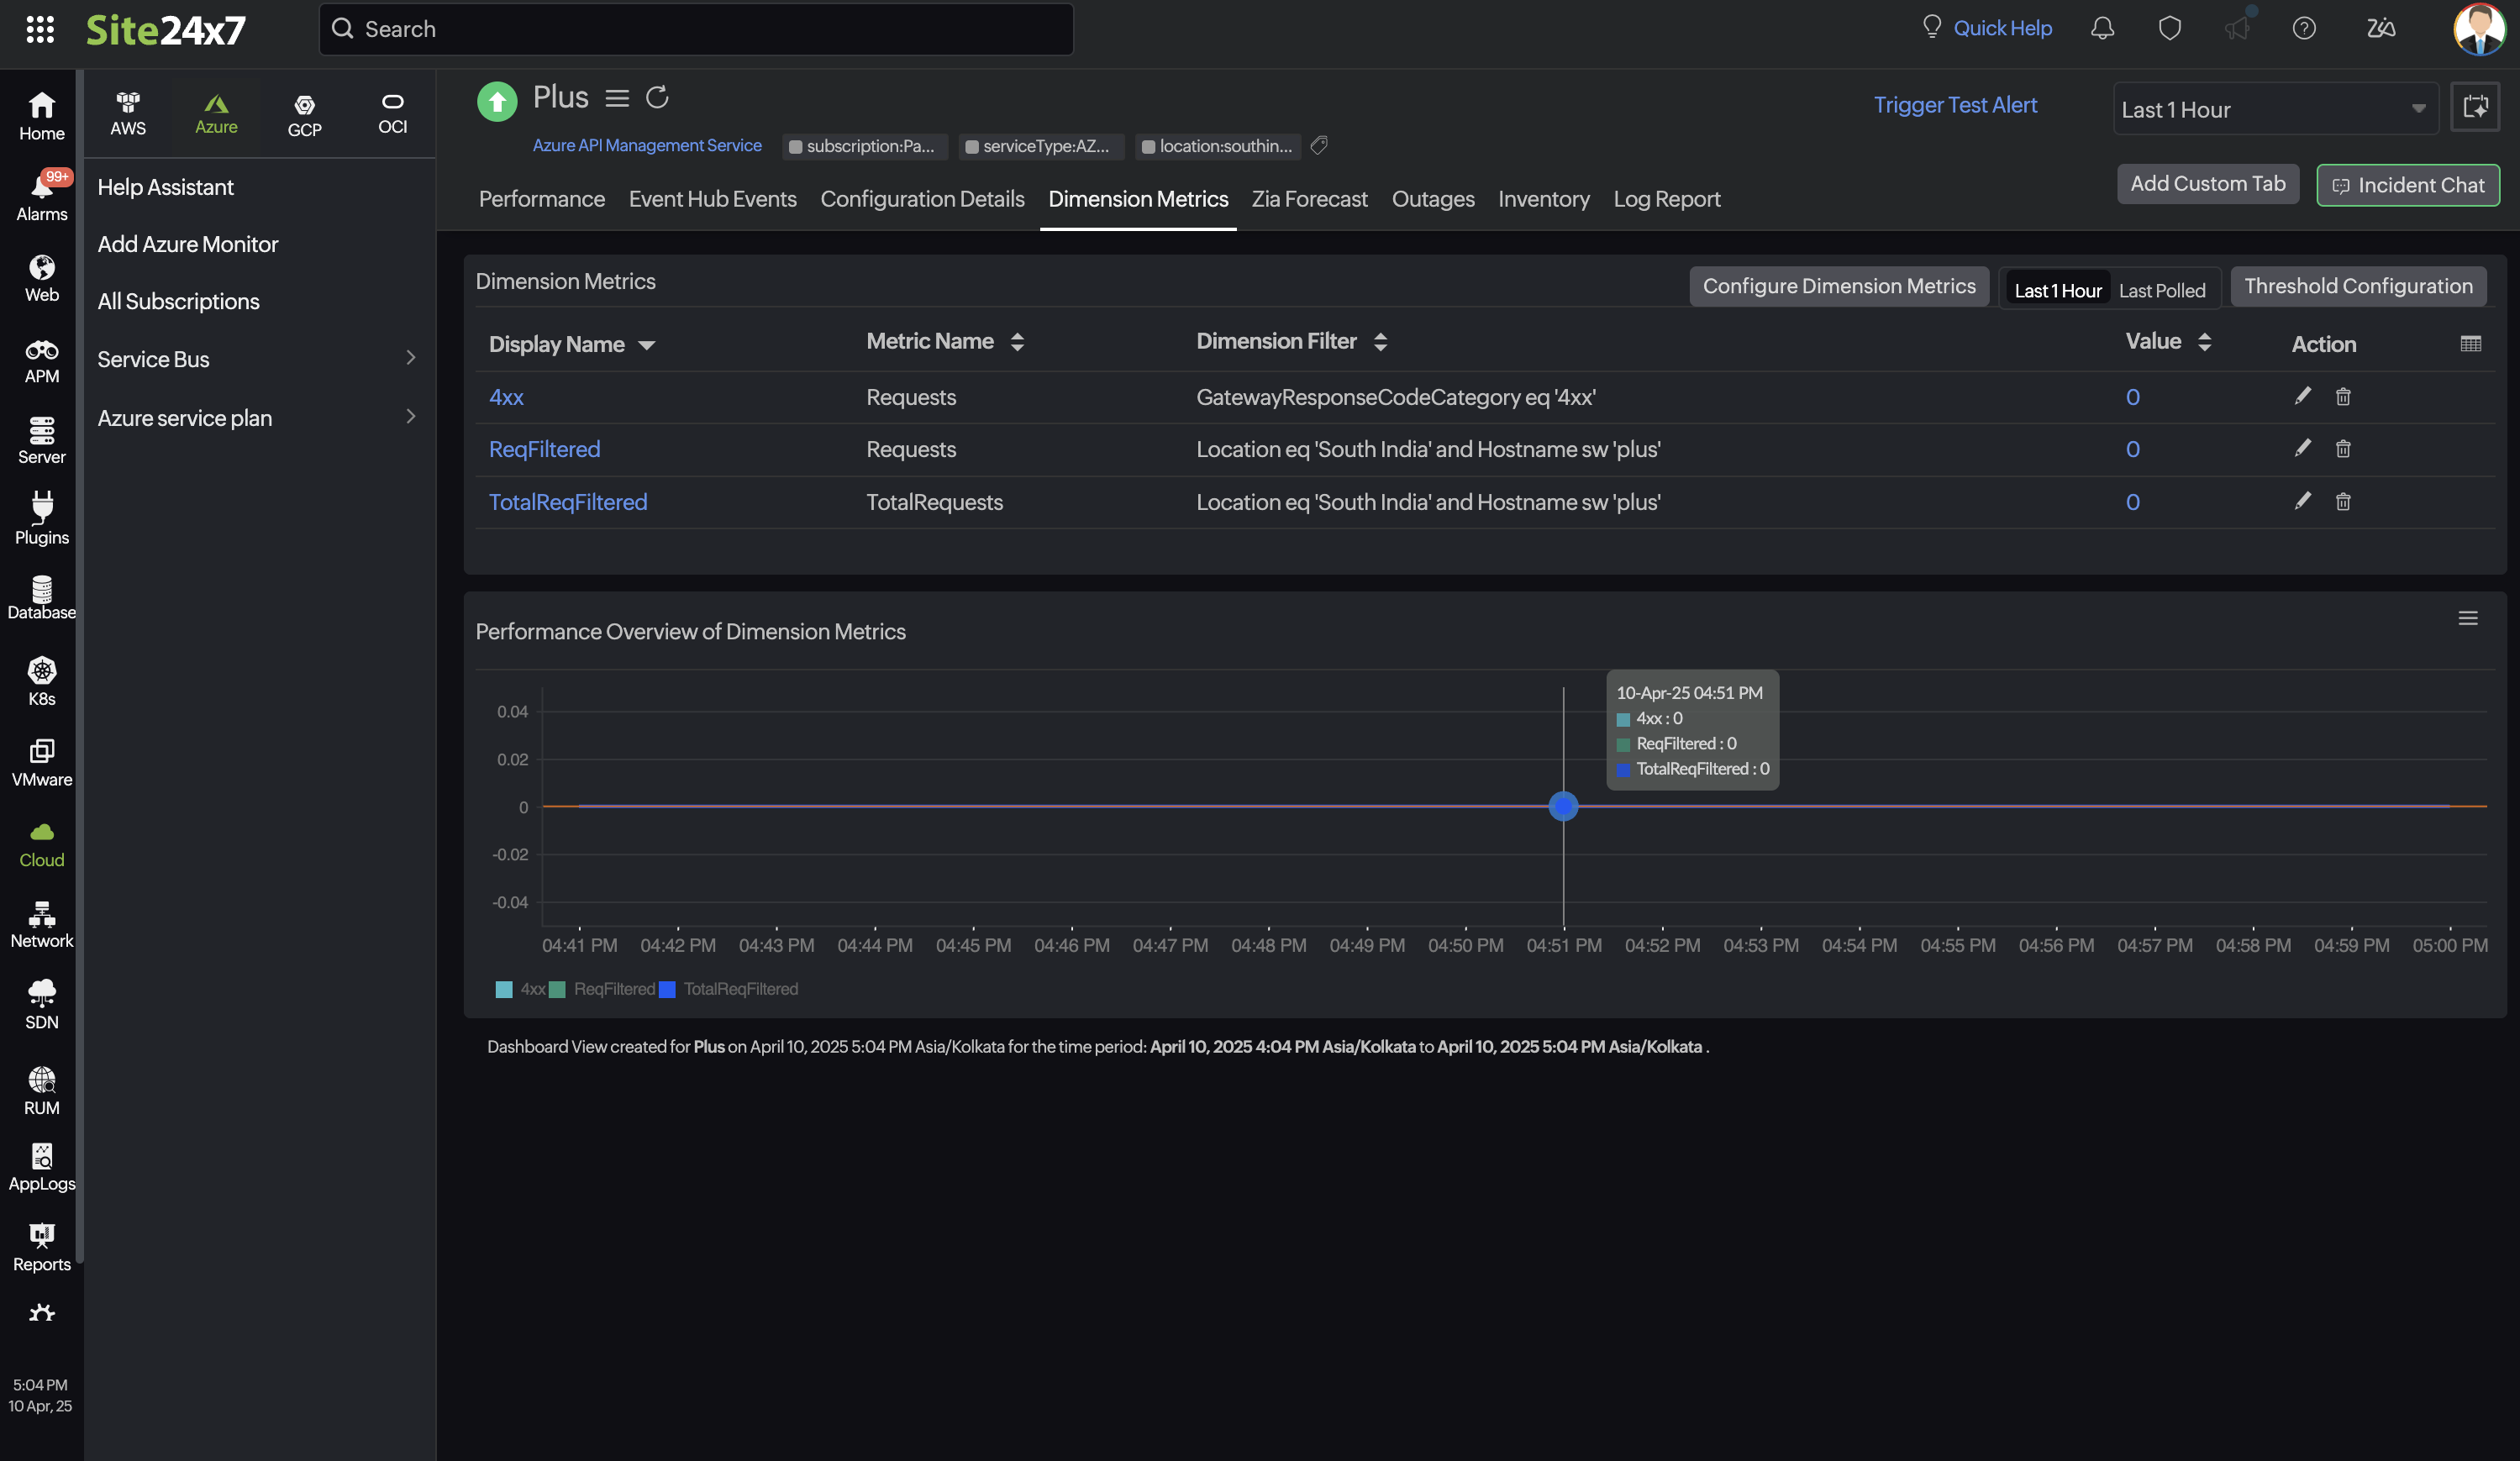
Dimension Metrics
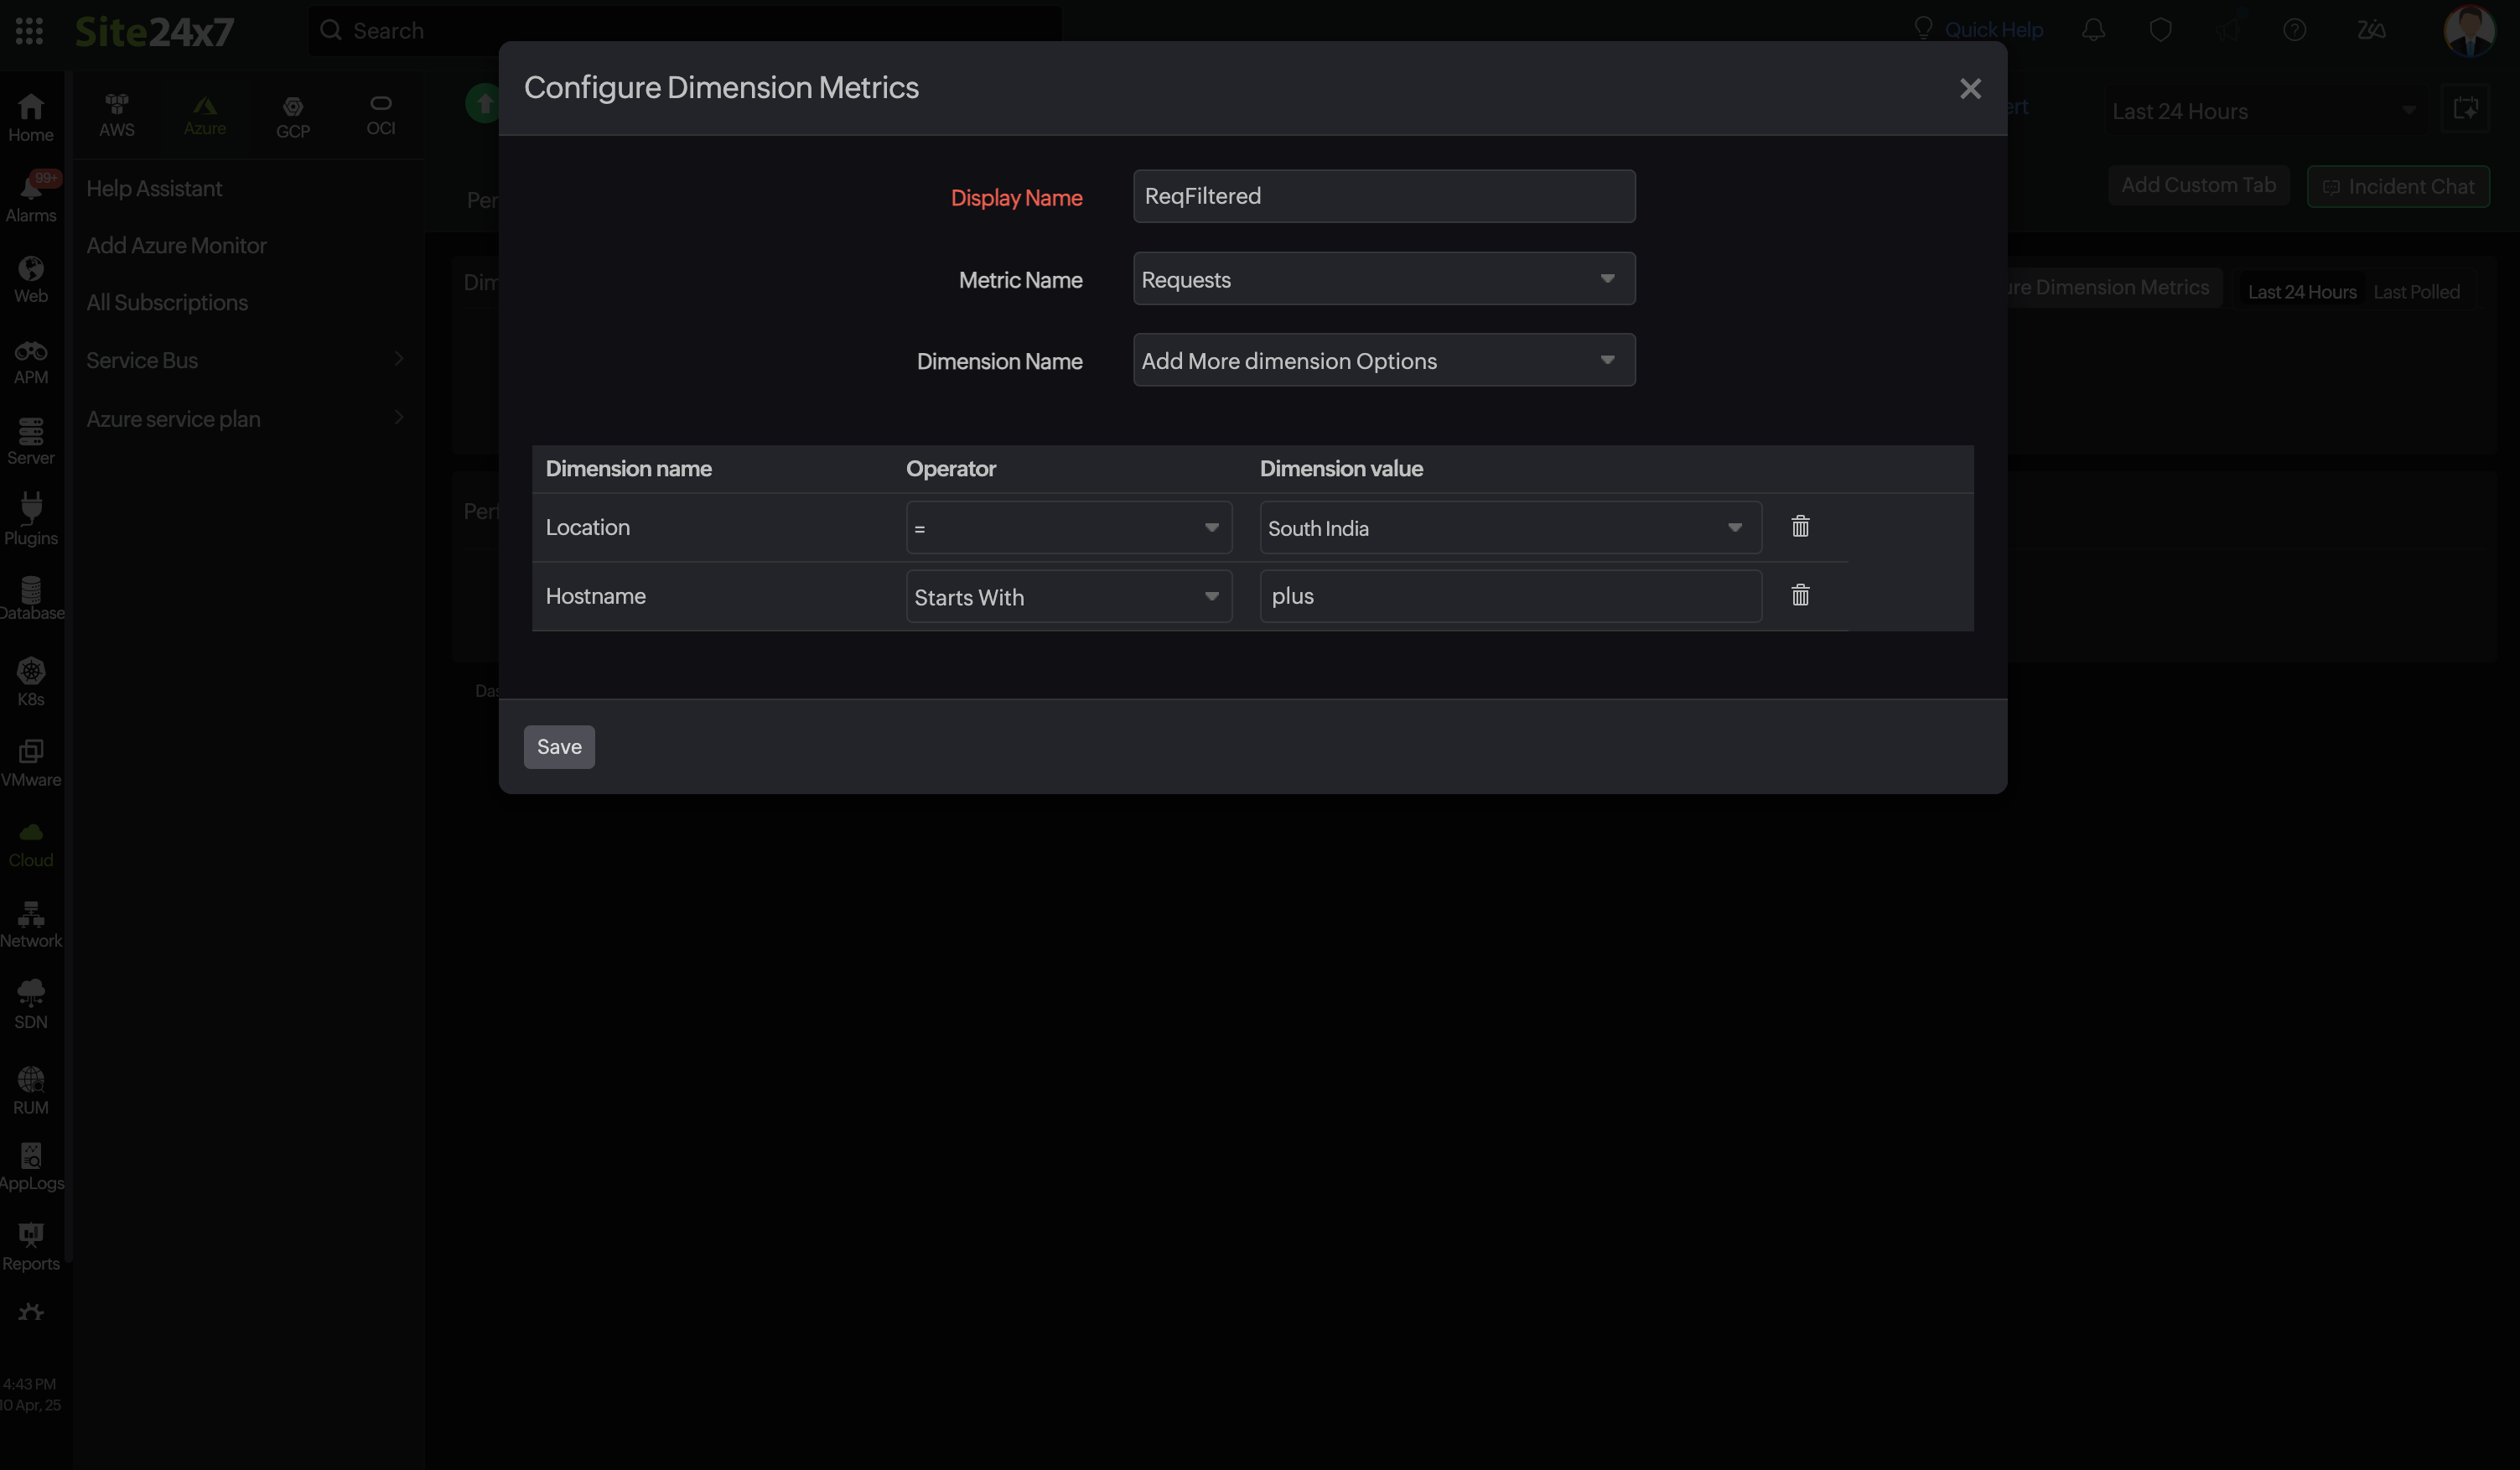
Configure Dimension Metrics to view the dimension metric information. Get alerts by applying the respective dimension filter and configuring thresholds for them. You can apply thresholds in bulk for the metrics. Edit and delete the monitored dimension metrics using the Action option. You can also fetch the various dimensions for a preferred metric by providing the Dimension value while configuring the dimension metric. You can monitor up to 25 dimension metrics.
Zia Forecast
By leveraging the AI-driven Zia framework, you can examine resource consumption measurements through the forecast chart located in the Zia Forecast tab. This chart predicts upcoming performance metrics based on a seven-day historical data analysis, providing insights into the expected metric usage for the next seven days.
Outages
The Outages tab provides the history of the API Management Service statuses, including Down, Trouble, and Critical.
Inventory
The Inventory tab provides licensing details, threshold and availability profiles, notification profiles, the assigned user alert group, and the monitor's creation and modification times.
Log Report
The Log Report tab lists all the logs collected during every data collection along with their statuses.
