Amazon Elastic Kubernetes Service Monitoring Integration
Amazon Elastic Kubernetes Service (Amazon EKS) enables you to easily deploy, manage, and scale containerized applications using Kubernetes on AWS. With Kubernetes you can automate the deployment, scaling, and management of containerized applications at scale.
Overview
Site24x7's integration with Amazon Elastic Kubernetes Service (EKS) provides you with the following six monitors so that you can effectively monitor your EKS environment.
- EKS Cluster: Monitors the overall health, performance, and availability of your entire EKS cluster.
- EKS Node: Tracks the status and resource utilization of each node within your EKS cluster.
- EKS Namespace: Observes the activity and resource usage within specific namespaces, allowing for more granular management.
- EKS Pod: Monitors the performance and status of individual pods, ensuring they run smoothly within your cluster.
- EKS Container: Monitors the health and resource consumption of containers within your pods.
- EKS Service: Monitors the performance and availability of services running on your EKS cluster, ensuring they are accessible and responsive.
Use case
Amazon EKS is a fully managed Kubernetes service that lets you run your application on both Amazon Elastic Compute Cloud (EC2) and AWS Fargate. Consider a use case where you have a containerized application in a cluster attached to the EKS monitor. When you integrate your Amazon EKS with Site24x7, then EKS Cluster, EKS Namespace, and EKS Node monitors will be created. If your cluster or node is down or facing an issue, you can identify and track the issue with the alerts configured for both the cluster- and node-level monitors.
Benefits of the integration between Site24x7 and Amazon EKS
Site24x7's integration with Amazon Elastic Kubernetes Service (EKS) enables you to monitor your Amazon EKS at the cluster, node, and namespace level.
With the integration between Site24x7 and Amazon EKS, you can:
- Achieve full-stack visibility into your monitored resources.
- Configure thresholds and receive alerts when your cluster or node is down.
- Get a detailed overview of node and pod performance metrics in the form of graphs with container insights.
Setup and configuration
1. If you haven't already, enable access to your AWS resources between your AWS account and Site24x7's AWS account by either:
- Creating Site24x7 as an IAM user.
- Creating a cross-account IAM role. Learn more
2. On the Integrate AWS Account page, select the EKS Cluster, EKS Node, EKS Namespace, EKS Pod, EKS Container, or EKS Service checkbox. Learn more
Prerequisite
- Install the Container Insights on Amazon EKS. Learn more
Policy and permissions
Site24x7 uses various Amazon EKS APIs to collect information about your clusters. Assign the AWS Managed policy ReadOnlyAccess to the Site24x7 entity (IAM user or IAM role) to help Site24x7 collect metrics and metadata. If you want to assign a custom policy, please make sure the following read-level actions are present in the policy JSON. Learn more
- "eks:DescribeCluster",
- "eks:ListClusters",
- "cloudwatch:ListMetrics"
Polling frequency
Site24x7 collects metric data on your clusters, namespace and nodes as per the poll frequency set, ranging from one minute up to one day. Learn more
Cluster - level metrics
| Metric name | Description | Statistic | Unit |
|---|---|---|---|
| cluster_failed_node_count | Number of failed nodes in a cluster | Maximum | Nodes |
| cluster_node_count | Total nodes in a cluster | Maximum | Nodes |
| namespace_number_of_running_pods | Number of pods running in namespaces | Maximum | Pods |
| service_number_of_running_pods | Number of pods running in services | Maximum | Pods |
| node_number_of_running_pods | Number of pods running in nodes | Maximum | Pods |
| node_number_of_running_containers | Number of containers running in nodes | Maximum | Containers |
| node_cpu_usage_total | CPU used by all nodes | Maximum | Units |
| node_cpu_limit | CPU assigned to nodes | Maximum | Units |
| node_cpu_reserved_capacity | CPU reserved for nodes | Average | Percentage |
| node_cpu_utilization | CPU used by nodes | Average | Percentage |
| node_filesystem_utilization | File system capacity on nodes | Average | Percentage |
| node_memory_limit | Memory assigned to nodes | Maximum | MB |
| node_memory_working_set | Memory used in working sets of nodes | Average | MB |
| node_memory_reserved_capacity | Memory reserved for nodes | Average | Percentage |
| node_memory_utilization | Memory utilized by nodes | Average | Percentage |
| node_network_total_bytes | Total network traffic in nodes | Sum | MB/sec |
| pod_cpu_reserved_capacity | CPU reserved for pods | Average | Percentage |
| pod_cpu_utilization | CPU utilized by pods | Average | Percentage |
| pod_cpu_utilization_over_pod_limit | CPU utilized over pod limit | Average, Minimum, and Maximum | Percentage |
| pod_memory_reserved_capacity | Memory reserved for pods | Average | Percentage |
| pod_memory_utilization | Memory utilized by pods | Average | Percentage |
| pod_memory_utilization_over_pod_limit | Memory utilized over pod limit | Average, Minimum, and Maximum | Percentage |
| pod_network_rx_bytes | Total bytes received by pods | Sum | MB/sec |
| pod_network_tx_bytes | Total bytes sent by pods | Sum | MB/sec |
Node - level metrics
| Metric name | Description | Statistic | Unit |
|---|---|---|---|
| node_number_of_running_pods | Number of pods running in nodes | Maximum | Pods |
| node_number_of_running_containers | Number of containers running in nodes | Maximum | Containers |
| node_cpu_reserved_capacity | CPU reserved for nodes | Average | Percentage |
| node_cpu_utilization | CPU used by nodes | Average | Percentage |
| node_filesystem_utilization | File system capacity on nodes | Average | Percentage |
| node_memory_reserved_capacity | Memory reserved for nodes | Average | Percentage |
| node_memory_utilization | Memory utilized by nodes | Average | Percentage |
| node_network_total_bytes | Total network traffic in nodes | Sum | MB/sec |
Namespace - level metrics
| Metric name | Description | Statistic | Unit |
|---|---|---|---|
| namespace_number_of_running_pods | Number of pods running in namespaces | Maximum | Pods |
| pod_cpu_utilization | CPU utilized by pods | Average | Percentage |
| pod_cpu_utilization_over_pod_limit | CPU utilized over pod limit | Average, Minimum, and Maximum | Percentage |
| pod_memory_utilization | Memory utilized by pods | Average | Percentage |
| pod_memory_utilization_over_pod_limit | Memory utilized over pod limit | Average, Minimum, and Maximum | Percentage |
| pod_network_rx_bytes | Total bytes received by pods | Sum | MB/sec |
| pod_network_tx_bytes | Total bytes sent by pods | Sum | MB/sec |
Pod - level metrics
| Metric name | Description | Statistic | Unit |
|---|---|---|---|
| pod_cpu_reserved_capacity | CPU reserved for pods | Average | Millicores |
| pod_cpu_utilization | CPU Utilized by pods | Average | Percentage |
| pod_cpu_utilization_over_pod_limit | CPU utilized over pod limit | Average, Minimum, and Maximum | Percentage |
| pod_memory_reserved_capacity | Memory reserved for pods | Average | Bytes |
| pod_memory_utilization | Memory utilized by pods | Average | Percentage |
| pod_memory_utilization_over_pod_limit | Memory utilized over pod limit | Average, Minimum, and Maximum | Percentage |
| pod_network_rx_bytes | Total bytes received by pods | Sum | MB/sec |
| pod_network_tx_bytes | Total bytes sent by pods | Sum | MB/sec |
| pod_number_of_container_restarts | Number of container restarts | Maximum | Containers |
| pod_cpu_request | The CPU requests for the pod. | Maximum | Millicores |
| pod_memory_request | The memory requests for the pod. | Maximum | Bytes |
| pod_cpu_limit | The CPU limit defined for the containers in the pod. | Maximum | Millicores |
| pod_memory_limit | The memory limit defined for the containers in the pod. | Maximum | Bytes |
| pod_status_failed | Indicates that all containers in the pod have terminated. | Maximum | Count |
| pod_status_ready | Indicates that all containers in the pod are ready. | Maximum | Count |
| pod_status_running | Indicates that all containers in the pod are running. | Maximum | Count |
| pod_status_scheduled | Indicates that the pod has been scheduled to a node. | Maximum | Count |
| pod_status_unknown | Indicates that the status of the pod can't be obtained. | Maximum | Count |
| pod_status_pending | Indicates that the pod has been accepted by the cluster, but one or more of the containers has not become ready yet. | Maximum | Count |
| pod_status_succeeded | Indicates that all containers in the pod have successfully terminated and will not be restarted. | Maximum | Count |
| pod_number_of_containers | Reports the number of containers defined in the pod specification. | Maximum | Count |
| pod_number_of_running_containers | Reports the number of containers in the pod that are currently in the Running state. | Maximum | Count |
| pod_container_status_terminated | Reports the number of containers in the pod that are in the Terminated state. | Maximum | Count |
| pod_container_status_running | Reports the number of containers in the pod that are in the Running state. | Maximum | Count |
| pod_container_status_waiting | Reports the number of containers in the pod which are in the Waiting state. | Maximum | Count |
| pod_interface_network_rx_dropped | The number of packets which were received and subsequently dropped a network interface for the pod. | Sum | MB/sec |
| pod_interface_network_tx_dropped | The number of packets which were due to be transmitted but were dropped for the pod. | Sum | MB/sec |
Container- level metrics
| Metric name | Description | Statistic | Unit |
|---|---|---|---|
| container_cpu_utilization | The percentage of CPU units being used by the container. | Average | Percentage |
| container_cpu_utilization_over_container_limit | The percentage of CPU units being used by the container relative to the container limit. | Average | Percentage |
| container_memory_utilization | The percentage of memory units being used by the container. | Average | Percentage |
| container_memory_utilization_over_container_limit | The percentage of memory units being used by the container relative to the container limit. | Average | Bytes/sec |
| container_memory_failures_total | The number of memory allocation failures experienced by the container. | Average | MB/sec |
| container_filesystem_usage | The amount of disk space currently being used by a container's file system. | Average | Bytes |
| container_filesystem_available | The amount of disk space currently available for use within a container's file system. | Average | Bytes |
| container_filesystem_utilization | The percentage of disk space used out of the total disk space available within a container's file system. | Average | MB/sec |
Service- level metrics
| CloudWatch metric | Description | Statistic | Unit |
|---|---|---|---|
| service_number_of_running_pods | The number of pods running the service or services in the cluster. | Maximum | Count |
| pod_cpu_utilization | The percentage of CPU units being used by pods. | Average | Percentage |
| pod_cpu_utilization_over_pod_limit | The percentage of CPU units being used by pods relative to the pod limit. | Average, Minimum, and Maximum | Percentage |
| pod_memory_utilization | The percentage of memory currently being used by the pods. | Average | Percentage |
| pod_memory_utilization_over_pod_limit | The percentage of memory that is being used by pods relative to the pod limit. | Average, Minimum, and Maximum | Percentage |
| pod_network_rx_bytes | The number of bytes per second being received over the network by the pod. | Sum | MB/sec |
| pod_network_tx_bytes | The number of bytes per second being transmitted over the network by the pod. | Sum | MB/sec |
Threshold configuration
Go to Admin > Configuration Profiles > Threshold and Availability (+) > choose the monitor type as EKS Cluster/EKS Node/EKS Namespace. You can set threshold values for all the metrics mentioned above. Further, for EKS Namespace and EKS Node monitors, you can set inactive namespaces and nodes respectively into maintenance in the threshold form.
Status propagation in EKS monitors
Site24x7’s EKS integration includes the status propagation feature, which lets alerts from EKS Node and EKS Namespace monitors be propagated to the parent EKS Cluster monitor.
- To enable propagation for Nodes, go to the Edit Threshold Profile page and set the Notify for Node Status Changes option to Yes.
- To enable propagation for Namespaces, set the Notify for Namespace Status Changes option to Yes.
You can also manage alerts for individual child monitors:
In addition to enabling these options at the cluster level, it is mandatory to configure individual child monitors for status alerts. Only the child monitors that are explicitly configured for status alerts will send alerts to the parent monitor.
To configure status alerts for child monitors:
- Open the EKS Cluster monitor and go to the Nodes or Namespaces tab.
- In the Action menu of a child monitor, click the pencil
 icon , and set Skip Alert to No.
 - To apply this for multiple or all child monitors, use the Threshold Configuration section of the respective tab and set Skip Alert to No in bulk.
Alerts will only be triggered for status changes that occur after these settings are configured. If a Node or Namespace had already changed status before setup, no alert will be sent. In that case, you can either manually change the status or wait for the next status change.
Forecast
Estimate future values of the following Amazon EKS Cluster performance metrics and make informed decisions about adding capacity or scaling your AWS infrastructure.
- Node CPU Usage
- Node CPU Utilization
- Node Memory Utilization
- Pod CPU Utilization
- Pod Memory Utilization
Similarly, you can also view the forecast for the following metrics of Amazon EKS Namespace:
- Pod CPU Utilization
- Pod Memory Utilization
- Service CPU Utilization
- Service Memory Utilization
- CPU Utilization
- Memory Utilization
Similarly, you can also view the forecast for the following metrics of Amazon EKS Node:
- CPU Utilization per Node
- Memory Utilization per Node
- Network per Node
Licensing
- Each EKS Cluster, EKS Node, and EKS Namespace monitor utilizes one basic monitor license.
- EKS Pod: Five EKS Pod monitors consume one basic monitor license.
- EKS Container: Five EKS Container monitors consume one basic monitor license.
- EKS Service: Each EKS Service monitor is considered a basic monitor.
Site24x7's EKS monitoring interface
The monitor data for each EKS monitor is given below.
EKS Cluster
You can view the following data in Site24x7's EKS Cluster monitor data on the following tabs:
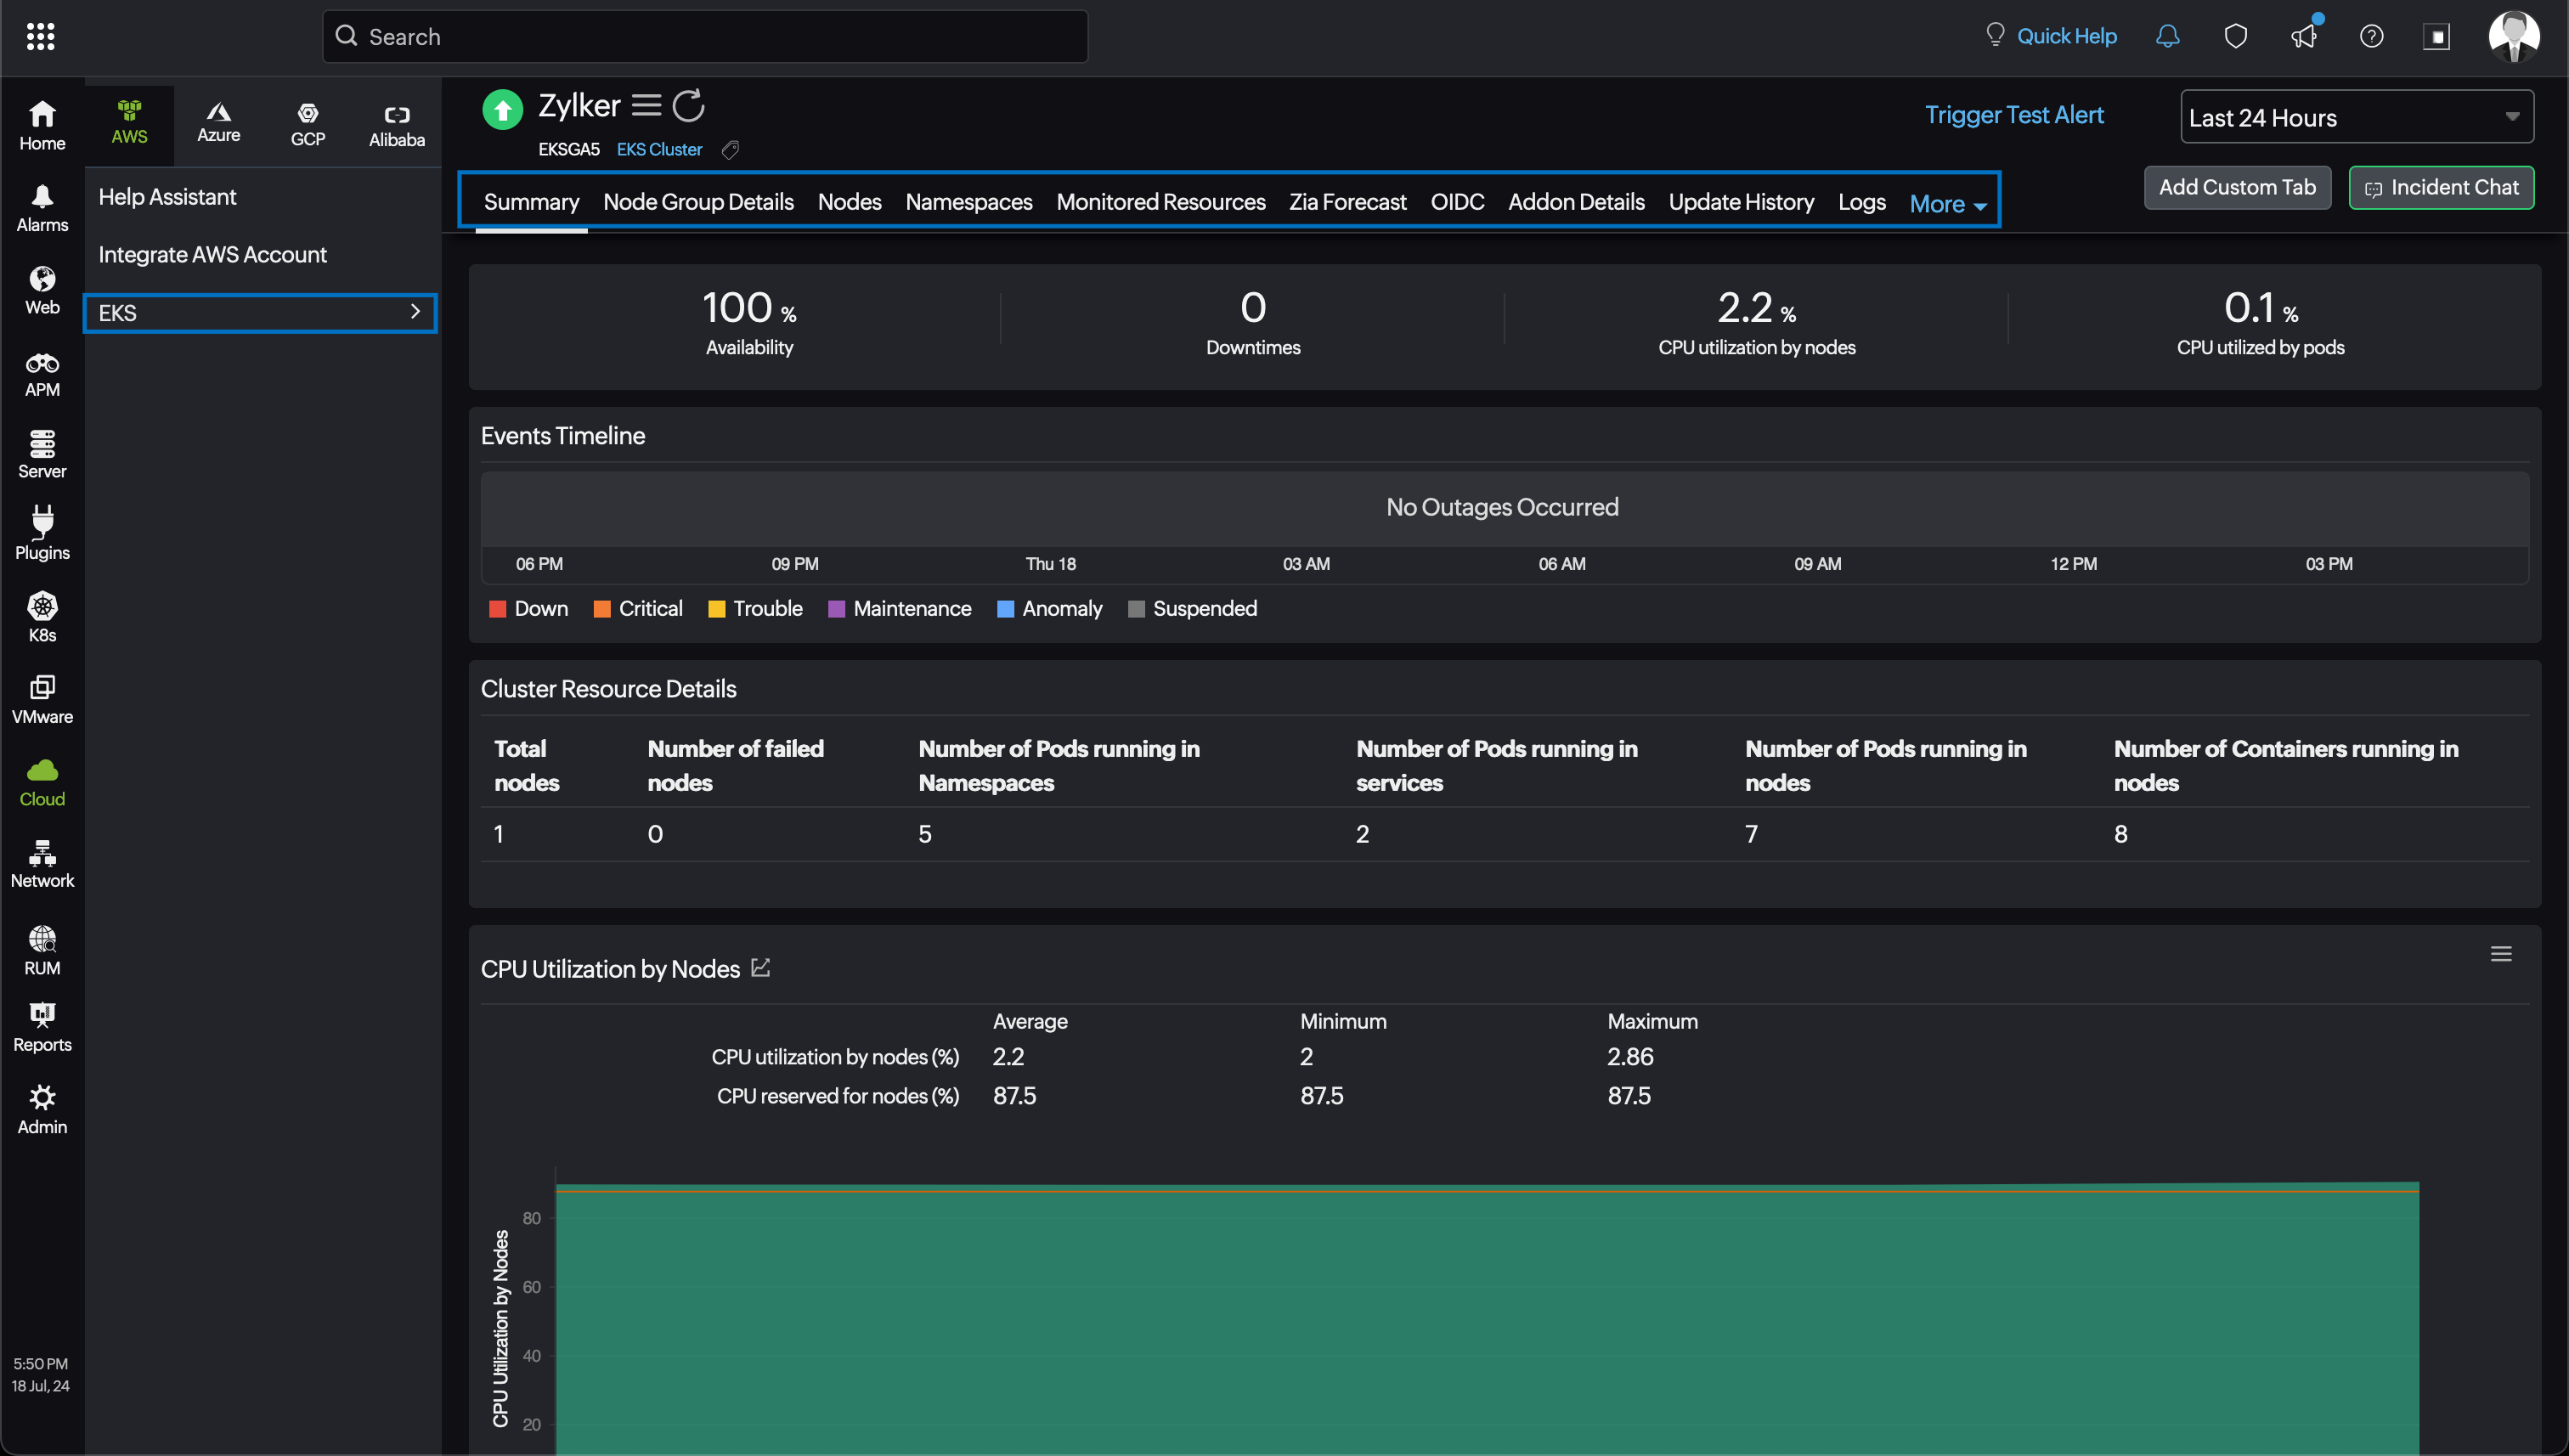
Summary
Gain an overview of different events occurring within each resource with time series charts. These charts provide event timelines on CPU utilization and memory utilization at a pod and node level in percentage, total bytes sent or received, the file system capacity, and the number of running containers and pods. All time series charts have the average, minimum, and maximum values listed.
Topology View
The Topology View tab delivers a live, resource-centric dependency map. It dynamically traces how your EKS Cluster resource is connected to its surrounding AWS infrastructure in real time, enabling faster root cause isolation when alerts fire. If any connected component is in a Critical state, it is marked accordingly within the topology view, along with the outage reason, so you can pinpoint the exact failure point without needing to navigate away from the monitor page. Unlike account-wide topology views, this tab scopes visualization to a single resource, answering the precise question: What does this EKS Cluster resource connect to, and what breaks if it does?You can trace the full dependency chain from the individual resource up through its primary parent entities to the Service type, Region, and AWS account levels.
Node Group
Node groups automate the provisioning and life cycle management of nodes (Amazon EC2 instances) for Amazon EKS Kubernetes clusters. You can view the list of node groups associated with your EKS monitor on the Node Group tab. This tab will be displayed only if a node group is created for the EKS cluster.
Fargate Profile
Fargate profiles are part of your Amazon EKS cluster and enable you to manage which pods start on Fargate and how they run with Fargate. The Fargate Profile tab shows the list of Fargate profiles associated with your EKS monitor. This tab will be displayed only if a Fargate profile is created for the EKS cluster.
Node and Namespace Details
Here you can view a list of nodes and namespaces associated with your Elastic Kubernetes environment. Click on an individual listing to see performance and resource usage stats associated with that resource. You can also set thresholds and be notified when any of these services fail by clicking the pencil icon under Action.
Monitored Resources
The Monitored Resources tab displays the EC2 instance and EC2 autoscaling group associated with the EKS cluster.
OIDC
OIDC is an object representing the OpenID Connect (OIDC) identity provider information for the cluster. You can view the OIDC associated with the EKS cluster on the OIDC tab.
Add-ons
Add-ons are common operational software, like Amazon VPC CNI, CoreDNS, and kube-proxy, that extend the Kubernetes operational functionality. The Add-ons tab displays the list of EKS cluster add-ons and the add-ons related to update events.
Update History
Obtain configuration updates related to the EKS cluster and node groups on the Update History tab.
Logs
Collect EKS control plane log entries for selected log types, with the logs being fetched from CloudWatch and categorized under log stream name.
Configuration
The configuration details of an EKS are provided under this tab. Details on the resource name, endpoint URL, region of a resource, status of a resource, security groups, subnets, VPC ID, status on the public access/private access, security groups, and many more are provided in this section.
EKS Node
You can view the EKS Node monitor data on the following tabs:
SummaryGain an overview of different events occurring within each resource with time series charts. These charts provide event timelines on CPU utilization and memory utilization at a node level in percentage, total bytes sent or received, the file system capacity, and the number of running containers and pods. All time series charts have the average, minimum, and maximum values listed.
Pods
The Pods tab displays EKS Pods Availability details and the list of EKS Pod monitors in the EKS Pods section. Click any monitor name to view the EKS Pod monitor details.
Topology View
The Topology View tab delivers a live, resource-centric dependency map. It dynamically traces how your EKS Node resource is connected to its surrounding AWS infrastructure in real time, enabling faster root cause isolation when alerts fire. If any connected component is in a Critical state, it is marked accordingly within the topology view, along with the outage reason, so you can pinpoint the exact failure point without needing to navigate away from the monitor page. Unlike account-wide topology views, this tab scopes visualization to a single resource, answering the precise question: What does this EKS Node resource connect to, and what breaks if it does?You can trace the full dependency chain from the individual resource up through its primary parent entities to the Service type, Region, and AWS account levels.
Zia Forecast
This tab shows the forecast chart that displays future points of a performance metric (measurement of resource usage) based on historical time series data. Thirty days of historical data is used to predict what your metric usage will be in the next thirty days.
Configuration
Obtain configuration details of the EKS Node monitor such as Instance ID, Node Name, Cluster Name, and Instance Type.
Outages
The Outages tab provides details on an outage's start time, end time, duration, and comments, if any.
Inventory
Obtain details like Cluster Name, Node Name, Region, and Monitor Licensing Category from the Inventory tab. Set and view the Threshold and Availability Profile and the Notification Profile according to the user in this tab.
Log Report
This tab offers a consolidated report of the EKS Node monitor's log status, which can be downloaded as a CSV file.
EKS Namespace
You can view the EKS Namespace monitor data on the following tabs:
Summary
Gain an overview of different events occurring within each resource with time series charts along with the configuration details. All time series charts have the average, minimum, and maximum values listed.
Pods
The Pods tab displays EKS Pods Availability details and the list of EKS Pod monitors in the EKS Pods section. Click any monitor name to view the EKS Pod monitor details.
Containers
The Containers tab displays EKS Container Availability details and the list of EKS Container monitors in the EKS Containers section. Click any monitor name to view the EKS Container monitor details.
Services
The Services tab displays EKS Service Availability details and the list of EKS Service monitors in the EKS Services section. Click any monitor name to view the EKS Service monitor details.
Topology View
The Topology View tab delivers a live, resource-centric dependency map. It dynamically traces how your EKS Namespace resource is connected to its surrounding AWS infrastructure in real time, enabling faster root cause isolation when alerts fire. If any connected component is in a Critical state, it is marked accordingly within the topology view, along with the outage reason, so you can pinpoint the exact failure point without needing to navigate away from the monitor page. Unlike account-wide topology views, this tab scopes visualization to a single resource, answering the precise question: What does this EKS Namespace resource connect to, and what breaks if it does?You can trace the full dependency chain from the individual resource up through its primary parent entities to the Service type, Region, and AWS account levels.
Zia Forecast
This tab shows the forecast chart that displays future points of a performance metric (measurement of resource usage) based on historical time series data. Thirty days of historical data is used to predict what your metric usage will be in the next thirty days.
Outages
The Outages tab provides details on an outage's start time, end time, duration, and comments, if any.
Inventory
Obtain details like Cluster Name, Namespace Name, Region, and Monitor Licensing Category from the Inventory tab. Set and view the Threshold and Availability Profile and the Notification Profile according to the user in this tab.
Log Report
This tab offers a consolidated report of the EKS Namespace monitor's log status, which can be downloaded as a CSV file.
EKS Pod
You can view the EKS Pod monitor data on the following tabs:
Summary
Get details of different events occurring within each resource with time series charts along with the configuration details. All time series charts have the average, minimum, and maximum values listed.
Containers
The Containers tab displays EKS Container Availability details and the list of EKS Container monitors in the EKS Containers section. Click any monitor name to view the EKS Container monitor details.
Outages
The Outages tab provides details on an outage's start time, end time, duration, and comments, if any.
Inventory
Obtain details like Cluster Name, Pod Name, Region, and Monitor Licensing Category from the Inventory tab. Set and view the Threshold and Availability Profile and the Notification Profile according to the user in this tab.
Log Report
This tab offers a consolidated report of the EKS Pod monitor's log status, which can be downloaded as a CSV file.
Topology View
The Topology View tab delivers a live, resource-centric dependency map. It dynamically traces how your EKS Pod resource is connected to its surrounding AWS infrastructure in real time, enabling faster root cause isolation when alerts fire. If any connected component is in a Critical state, it is marked accordingly within the topology view, along with the outage reason, so you can pinpoint the exact failure point without needing to navigate away from the monitor page. Unlike account-wide topology views, this tab scopes visualization to a single resource, answering the precise question: What does this EKS Pod resource connect to, and what breaks if it does?You can trace the full dependency chain from the individual resource up through its primary parent entities to the Service type, Region, and AWS account levels.
EKS Container
You can view the EKS Container monitor data on the following tabs:
Summary
Get details of different events occurring within each resource with time series charts along with the configuration details. All time series charts have the average, minimum, and maximum values listed.
Outages
The Outages tab provides details on an outage's start time, end time, duration, and comments, if any.
Inventory
Obtain details like Cluster Name, Container Name, Region, and Monitor Licensing Category from the Inventory tab. Set and view the Threshold and Availability Profile and the Notification Profile according to the user in this tab.
Log Report
This tab offers a consolidated report of the EKS Container monitor's log status, which can be downloaded as a CSV file.
Topology View
The Topology View tab delivers a live, resource-centric dependency map. It dynamically traces how your EKS Container resource is connected to its surrounding AWS infrastructure in real time, enabling faster root cause isolation when alerts fire. If any connected component is in a Critical state, it is marked accordingly within the topology view, along with the outage reason, so you can pinpoint the exact failure point without needing to navigate away from the monitor page. Unlike account-wide topology views, this tab scopes visualization to a single resource, answering the precise question: What does this EKS Container resource connect to, and what breaks if it does?You can trace the full dependency chain from the individual resource up through its primary parent entities to the Service type, Region, and AWS account levels.
EKS Service
You can view the EKS Service monitor data on the following tabs:
Summary
Get details of different events occurring within each resource with time series charts along with the configuration details. All time series charts have the average, minimum, and maximum values listed.
Pods
The Pods tab displays EKS Pods Availability details and the list of EKS Pod monitors in the EKS Pods section. Click any monitor name to view the EKS Pod monitor details.
Outages
The Outages tab provides details on an outage's start time, end time, duration, and comments, if any.
Inventory
Obtain details like Cluster Name, Service Name, Region, and Monitor Licensing Category from the Inventory tab. Set and view the Threshold and Availability Profile and the Notification Profile according to the user in this tab.
Log Report
This tab offers a consolidated report of the EKS Service monitor's log status, which can be downloaded as a CSV file.
Topology View
The Topology View tab delivers a live, resource-centric dependency map. It dynamically traces how your EKS Service resource is connected to its surrounding AWS infrastructure in real time, enabling faster root cause isolation when alerts fire. If any connected component is in a Critical state, it is marked accordingly within the topology view, along with the outage reason, so you can pinpoint the exact failure point without needing to navigate away from the monitor page. Unlike account-wide topology views, this tab scopes visualization to a single resource, answering the precise question: What does this EKS Service resource connect to, and what breaks if it does?You can trace the full dependency chain from the individual resource up through its primary parent entities to the Service type, Region, and AWS account levels.
-
On this page
- Overview
- Use case
- Benefits of the integration between Site24x7 and Amazon EKS
- Setup and configuration
- Prerequisite
- Policy and permissions
- Polling frequency
- Cluster-level metrics
- Node-level metrics
- Namespace-level metrics
- Pod-level metrics
- Container-level metrics
- Service-level metrics
- Threshold configuration
- Status propagation
- Forecast
- Licensing
- Site24x7's EKS monitoring interface