WebSocket monitor
WebSocket is a protocol that helps establish two-way, open communication between a web browser and a server. Unlike one-way connections like HTTP that require a separate connection with every action performed on the website, WebSocket secures a connection and keeps it open until the session is terminated. WebSocket creates an uninterrupted connection between two devices and updates the content without having to wait for a request from the user. This provides low latency communication for the user, delivering a dynamic and real-time web experience.
Site24x7 monitors your WebSocket endpoints and identifies service interruptions. Receive notification about service disruption and unusual spikes in response times so you can take corrective action.
How does WebSocket monitoring work in Site24x7?
- A WebSocket connection is initiated from the given secure WebSocket URL. When a connection is initiated, a handshake between both ends of the WebSocket is established. If the handshake is unsuccessful, the monitor status will be reported as Down.
- Upon a successful handshake, a ping message is sent to the other end of the WebSocket and a pong response is returned.
- Once the pong response is received, a successful connection to the WebSocket is established, and the WebSocket’s availability and response time are determined.
Add a Web Socket Monitor
- Click Admin > Inventory > Monitors > Add Monitor.
- Select WebSocket in Add Monitor page.
- Specify the following details to add the Web Socket monitor:
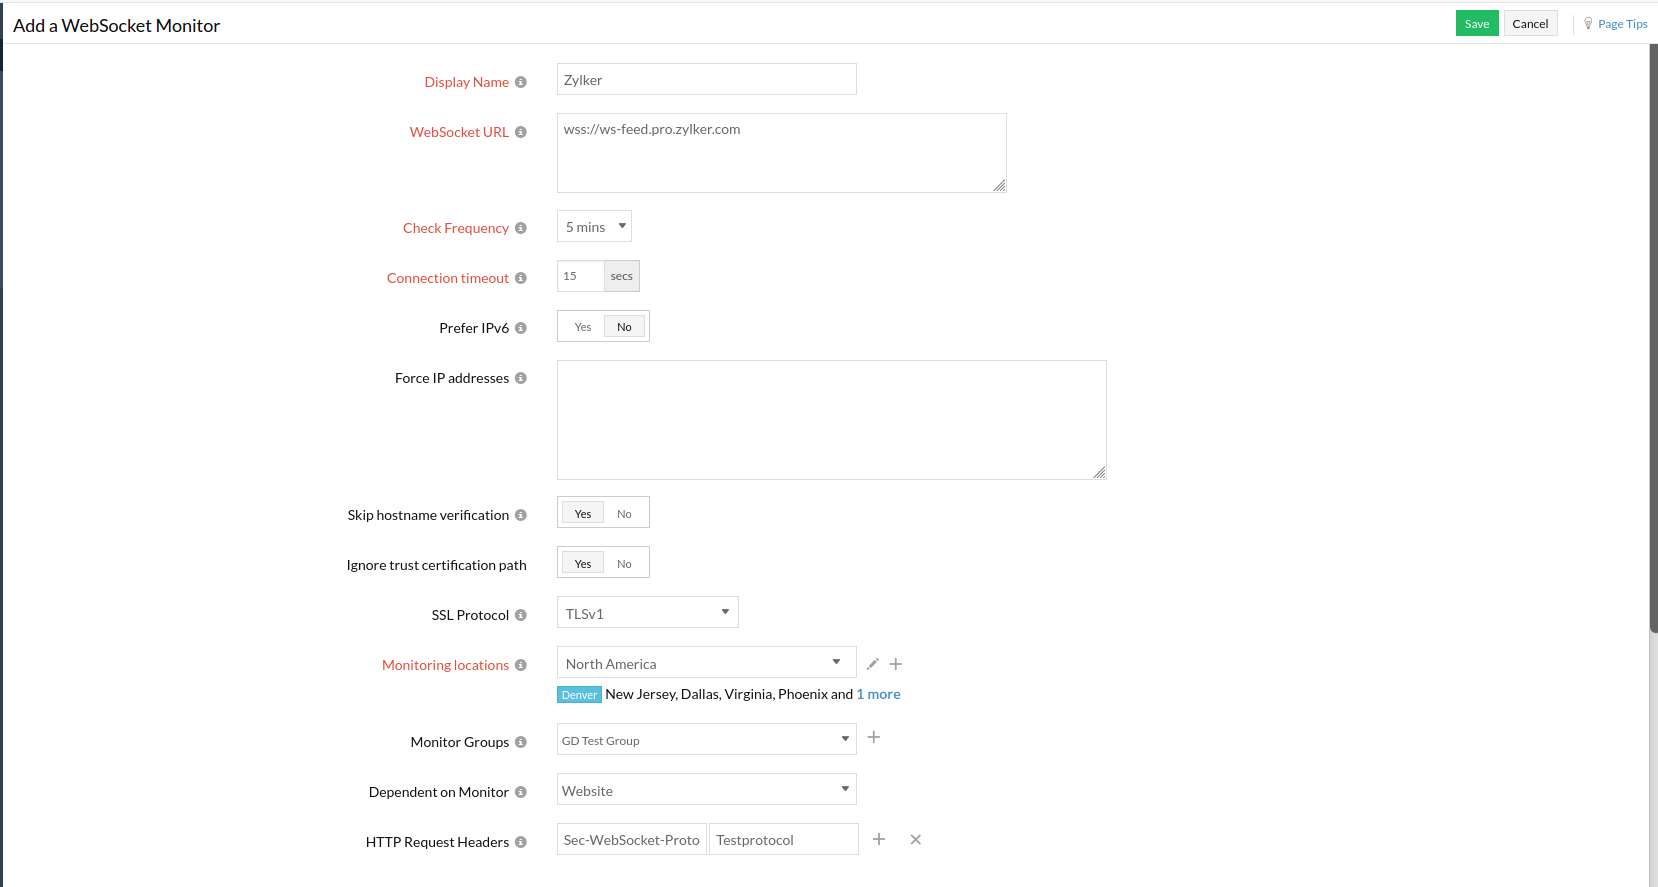
- Display Name: Enter a name to identify the monitor.
- WebSocket URL: Enter the ws or wss endpoint you wish to monitor.
- Check Frequency: Choose the required polling frequency. The frequency can be set from 1 minute to 1 day.

- Connection Timeout: Specify the time in seconds needed to establish a connection with the target server. If the connection is not established within the specified time, the WebSocket will be reported as down with "Could not establish connection" as the reason.
- Prefer IPv6: If you want to monitor your WebSocket over IPv6 enabled locations, simply move the rocker button to "YES" when creating or editing a monitor form.
Note- Site24x7 lets you monitor your dual-stacked IPv4/IPv6 based infrastructure as per you need. IPv4 will be enabled as the default protocol. You'll be able to monitor your IPv6 infrastructure, once you enable the rocker button to IPv6. If the connectivity over IPv6 fails, it will not fall back to IPv4 automatically. Read more.
- Enabling IPv6 in the monitoring form doesn't make it compatible to monitor IPv4, by default. If you want to monitor a resource, which is compatible with both IPv4 and IPv6–you'll have to set up two separate monitor checks for this.
- Force IP address: Enter the IPv4/IPv6 addresses of the WebSocket URL. The first IP address is checked for a connection. If no connection is established, the next IP address in the list is checked. This field is optional and you can use it instead of entering the domain name given in the WebSocket URL field above.
- Skip hostname verification: Choose Yes to verify if the hostname on the certificate matches the hostname specified above in the WebSocket URL field.
- Ignore trust certification path: Use this option to validate the SSL/TLS certificate chain. Enable this if you don't want to identify any potential revocation information about your host's certificate; by default, this option will be disabled.
NoteWhen an SSL/TLS Certificate Trust Check fails, it may be due to conditions like, "Self-signed certificate," "Intermediate certificates missing," or "Intermediate certificate chain incorrect." Site24x7 identifies and highlights these issues in the Monitor Details Summary tab. For any other condition, the default message will be shown. Learn more.
- SSL Protocol: Choose the SSL version number to be used by the client while communicating with the server.
- Monitoring Locations: Choose global locations from the dropdown list to setup monitoring of your WebSocket from these locations. You must configure atleast a primary location for monitoring. You can either pick IPv6/IPv4 locations or set-up an On-Premise Poller to serve as a monitoring station.
To know more, refer Location Profile. - Monitor Groups: You can associate your monitor with multiple monitor groups by selecting the relevant monitor groups from the drop down list. This allows in logical grouping of your monitors.
To learn how to create a monitor group for your monitors, refer Monitor Groups. - Dependent on Monitor: Select a monitor from the drop-down list to choose it as your dependent resource. You can add up to 5 monitors as dependent resources. Alerts to your monitor will be suppressed based on the DOWN status of your dependent resource.
NoteConfiguring a dependent resource and suppressing alerts based on the dependent resource's status is part of providing you with better false alerts protection. Learn more about alert suppression at monitor level.
NoteIf you select "None" in the dependent resource field, alerting will progress as per your normal configuration settings. No alerts will be suppressed in this case as the monitor doesn't have any dependent resource.
NoteMultiple monitor group support for monitors allow a monitor to be associated with multiple dependent resources in different monitor groups. If during a normal monitor status check, any one of these dependent resources' status is identified as DOWN, the alert for the monitor will be automatically suppressed. However, the dependency configuration at monitor level is always given the higher priority over any other monitor group level dependency configuration for suppressing alerts.
- HTTP Request Headers: Add additional header names and header values when you wish to customize the default HTTP request header information. For instance you can use the format : Sec-WebSocket-Protocol
Note
To use a credential profile in HTTP Configurations, type $ and a list of available credential profiles will appear—select the desired one from this list. Learn more about credential profiles.
- Specify the following details for Configuration Profiles:
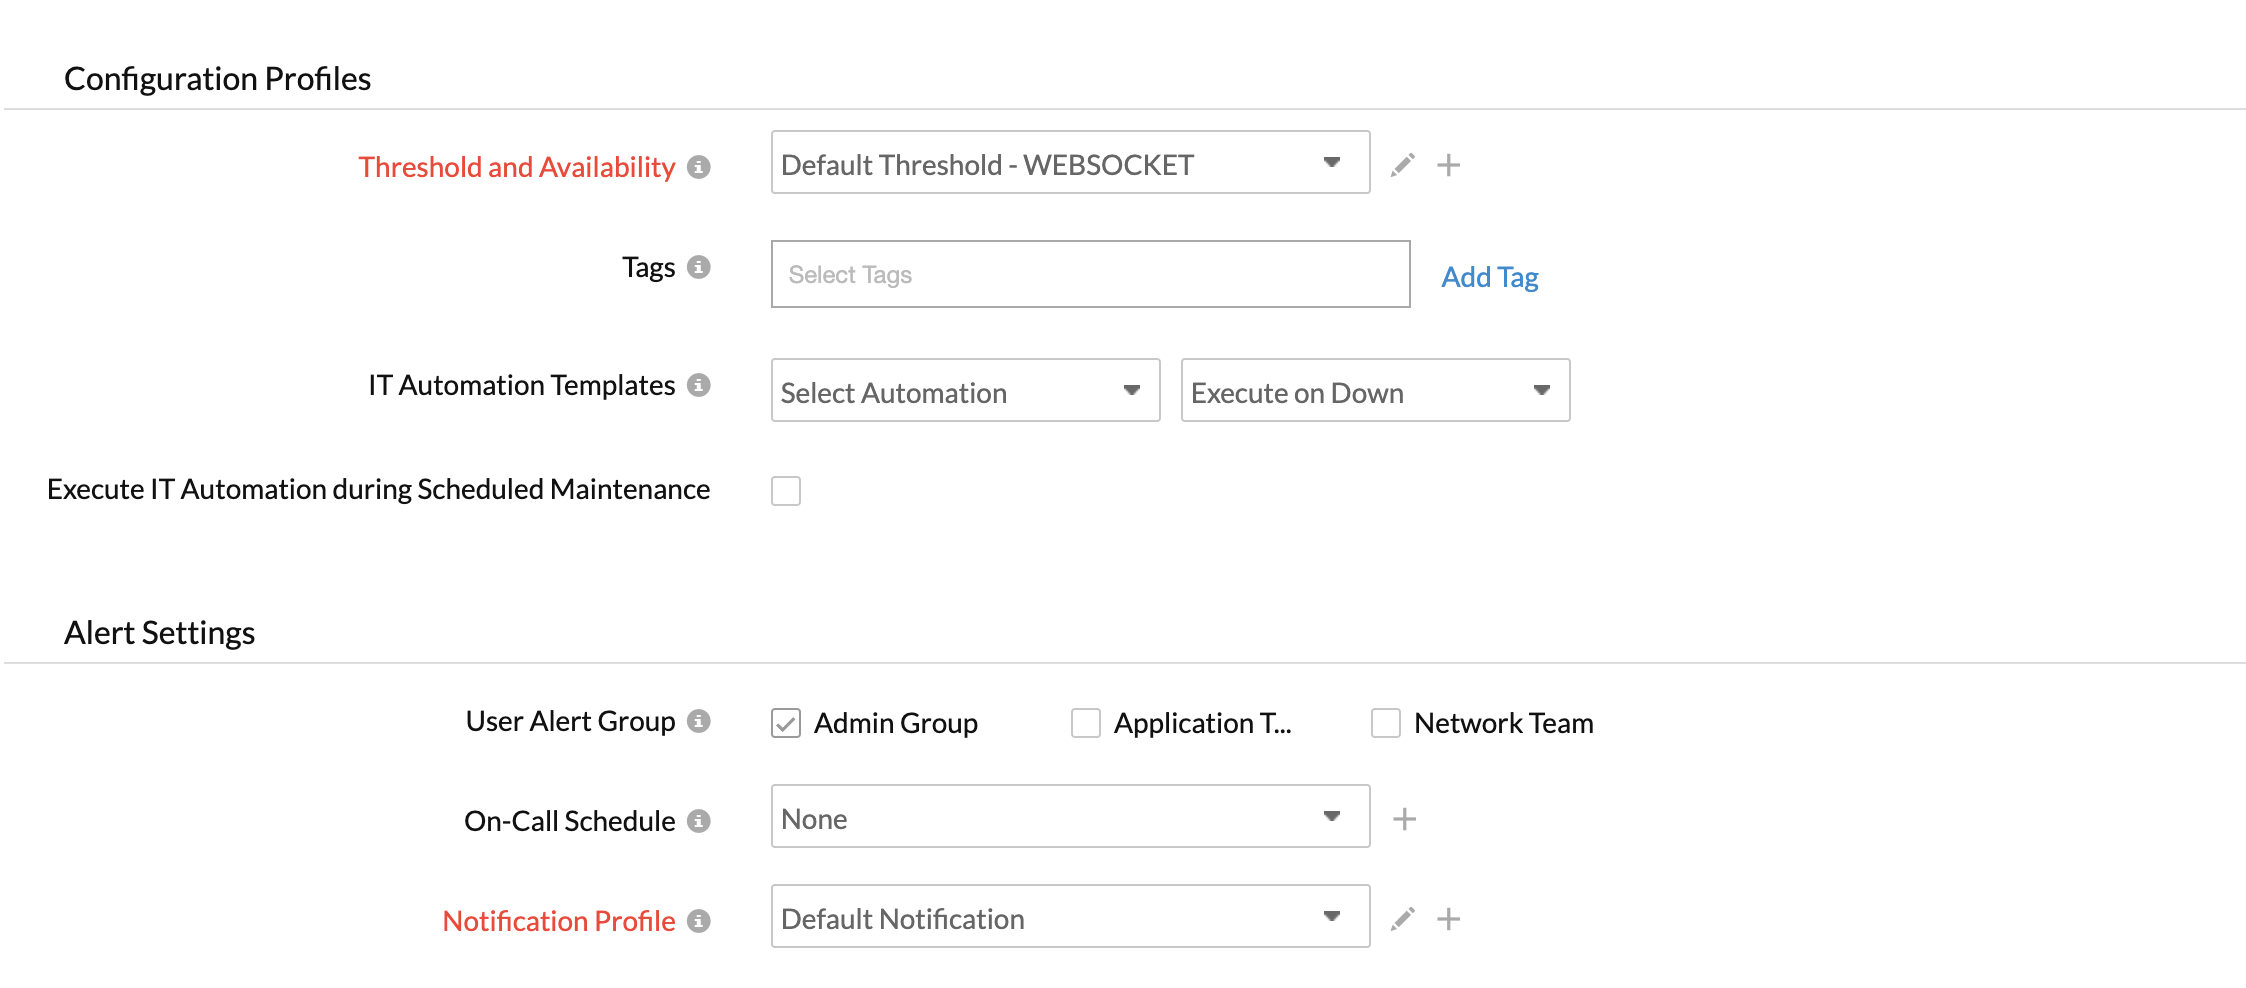
- Threshold and Availability: Select a threshold profile from the drop down list or choose the default threshold set available and get notified when the resources cross the configured threshold and availability. To create a customized threshold and availability profile, refer Threshold and Availability.
- Tags: Associate your monitor with predefined Tag(s) to help organize and manage your monitors creatively. Learn how to add Tags.
- IT Automation: Select an automation to be executed when the WebSocket is down/trouble/up/any status change/any attribute change. The defined action gets executed when there is a state change and selected user groups are alerted.
To automate corrective actions on failure, refer IT Automation.

- Alert Settings:
- User Alert Group: Select the user group that need to be alerted during a outage. To add multiple users in a group, see User Alert Groups.
- On-Call Schedule: The On-Call Schedule option helps you to ensure that the notifications are sent to assignees in specific shift hours helping them to quickly respond to alerts or incidents. Choose an On-Call of your preference from the drop-down.
- Notification profile: Choose a notification profile from the drop down or select the default profile available. Notification profile helps to configure when and who needs to be notifed in case of downtime.Refer Notification Profile to create a customized notification profile.
NoteYou can receive alerts if the monitors are associated to user groups irrespective of the On-Call shift you've configured.
- Third-Party Integration: Associate your monitor with a pre-configured third-party service. It lets you push your monitor alarms to selected services and facilitate improved incident management. If you haven't setup any integrations yet, navigate across to Admin > Third Party Integration to create one. Tell me more.
- Click Save.
Note
Once the monitor setup is completed, Site24x7 deep discovery wizard scans your domain and auto detects all related internet resources for your domain that can be added to your account for a comprehensive internet services monitoring. Explore more about internet services deep discovery.
