Availability SLA Report
Do you wish to monitor your Availability SLAs on a persistent manner?
Our availability SLA report helps IT teams to proactively monitor their service performance and ensure the levels of availability is strictly adhered to. The report validates the availability trend of a specific monitor over a set period of time and then provides deep insight into the monitor performance through detailed graphical trends.
Availability SLA Report captures the real time status and performance trends of all the configured monitors over a specified time. The following details and parameters can be extracted from the availability SLA dashboard:
- Monitor Name: Name of the configured monitor.
- SLA Name: This highlights the name that uniquely identifies the SLA.
- Group Name: It shows all the associated monitor group names to which the monitor is associated to.
- Goal (%): Defines the monitor's SLA goal value in percentage.
- Achieved (%): Describes the monitor's achieved SLA value in percentage.
- Status: Shows whether the monitor has achieved its SLA Goals or not. It is identified as Success or Failure.
Generate Availability SLA Report
- Login to Site24x7 account.
- Navigate to Reports>SLA Report>Availability SLA.
- Choose the desired Time Period from the drop down list.
Note
You can choose a time period that ranges from today to as long as 30 days back. Additionally, you can also use the Custom Period option to create an SLA report for the date range less than 100 days. When you choose the start date in custom period, the end date will be limited to 99 days ahead from the start date. It allows you to view and share quarterly SLA reports with your clients. Custom period is supported only in specific monitor level and not across monitors.
- Select the required monitor from the list of monitors; Click View Report to generate Availability SLA Report for the selected monitor.

- Choose the relevant Time Period and Unit of Time from the drop down, to view the Availability SLA report. You can also share the SLA report via an email or export as a PDF report. Email can be sent to only those verified users who have agreed to receive emails from Site24x7.
Interpret the Availability SLA Report
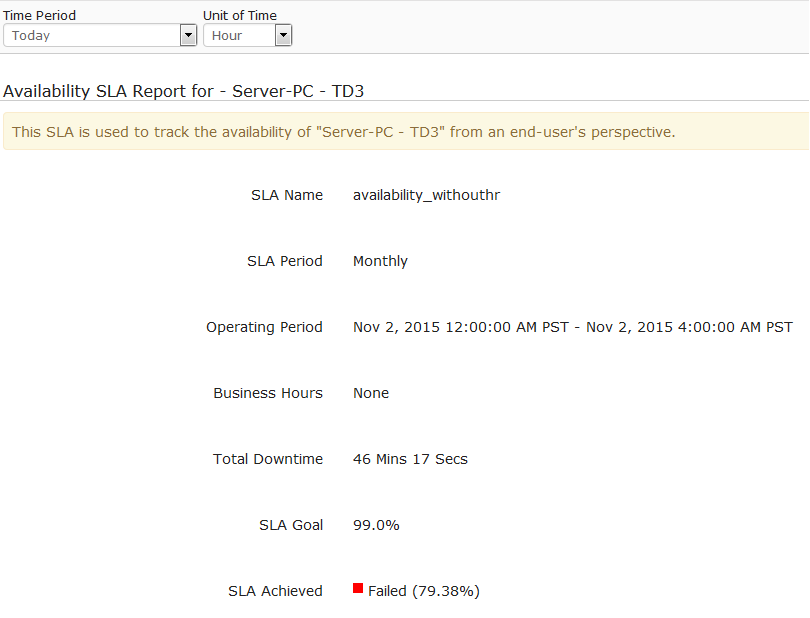
Availability SLA Report provides comprehensive insight into the availability trends of the monitor for the selected period of time.
The following details can be inferred from the report:
- SLA Name: The Specified name that uniquely identifies the SLA.
- SLA Period: It determines the selected time period, where the terms of SLA have to be met regarding the service delivery. It is either selected as monthly, quarterly or yearly SLA.
- Operating Period: The time period during when the SLA is measured and monitored.
- Business Hours: Describes the time period defined as the most critical to your business and configured while setting up your SLA. The availability SLA will then be applicable for the time frame defined within the Business Hour. This time period will be shown None, if no specific business time is configured.
For example, assume you have defined a business hour named 'Friday' as between 08:00 to 20:00 hours. This timeframe is applicable every Friday. Now if you specify this business hour while creating new availability SLA, it means the SLA will be applicable from 08:00 to 20:00 hours on Fridays. - Total Downtime: The cumulative downtime data recorded during the operating period.
- SLA Goal: To meet the SLA, availability is normally set as equal to, greater than, greater than equal to, less than or less than or equal to a percentage value. By default, it is 99.0 percentage.
- SLA Achieved: Describes the monitor's achieved SLA value in percentage. The status of SLA is defined as Success or Failed.

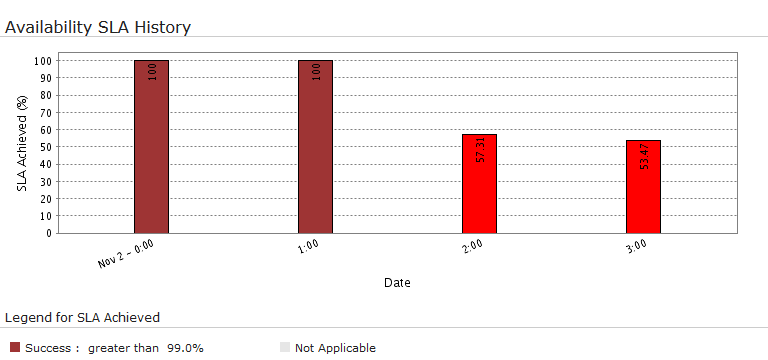
Graphical Interpretation
The Availability SLA History graph depicts the percentage of SLA achieved by the monitor, for a specified unit of time during the selected operating period. The average SLA achieved by the monitor can be deducted from this graphical data. Legends are provided below the graph to help decode the trends.

