Custom Report previous version
Custom Report
Custom Report lets you create personalized comparison reports for your business needs. You can compile precise metrics of your chosen monitors for specified time periods to generate a single easy-to-comprehend report. All required metrics for your chosen monitors are listed here for quick analysis and troubleshooting. Use it to gather ad-hoc historical and current data on your monitors and identify defect details based on specific monitor and attribute selection. You can export the custom report to PDF. You can create, view and delete all your custom reports as per your need. New parameters can be added to exisiting reports.
Similar to other Availability and Performance reports, you can build custom reports for all your monitor types for analyzing resource parameters like response time, CPU utilization, Memory, and more. It enables you to analyze performance parameters for individual or multiple monitors in a specific time period or over multiple time periods. A quick tabular based report gives you clear insight to undertake instant performance troubleshooting.
Generate Custom Report
- Log in to Site24x7.
- Navigate to Reports > Custom Report.
- Click Create New Custom Report.
NoteAlternatively, you can also access the Create Custom Report button under any Monitor, Monitor Group, or SLA Reports tab.

- Provide the details below to customize your report:
- Custom Report Name: Provide a name for the report.
- Add Description: Add a brief description to summarize the comparison in the report. This will be useful to quickly identify the context of the report while sharing it with other users.
- Monitor Types: Specify the types of monitors that you want to compare during a performance analysis. You can pick multiple or all monitor types that are configured in your account.
- Attributes: Specify all the performance attributes relevant to your selected monitor types that you wish to compare during a trend analysis. The performance attribute is listed based on the monitor type that you've selected.
NoteFor the Monitor Types: Website, REST API, and SOAP Web Service alone, you'll have an option to select the attributes, such as DNS Time, Connection Time, SSL Handshake Time, First Byte Time, and Download Time.

- Monitors: Pick specific or all configured monitors to execute a quick performance comparison.
- Bulk Period Selector: You can pick your desired time periods to generate the performance comparison report.
NoteYou can bulk select up to five time periods. You can select time ranges that's hourly-based or even upto a year back. Additionally, you can specify custom period range by selecting date and time using a calendar view.
- Once all the parameters are inserted, click the Generate Report button to create the ad-hoc report in a tabular view.

View Custom Report
All existing custom reports can be viewed under the "Saved Views" option. You can additionally edit an existing report by clicking the same. Super Admin, Admin, and Operator roles can create, view, and delete Custom Reports. Operators can create, update, and delete Custom reports created by themselves. Operators do not have sufficient privilege to edit/delete a report created by other user roles.

Interpret Custom Report
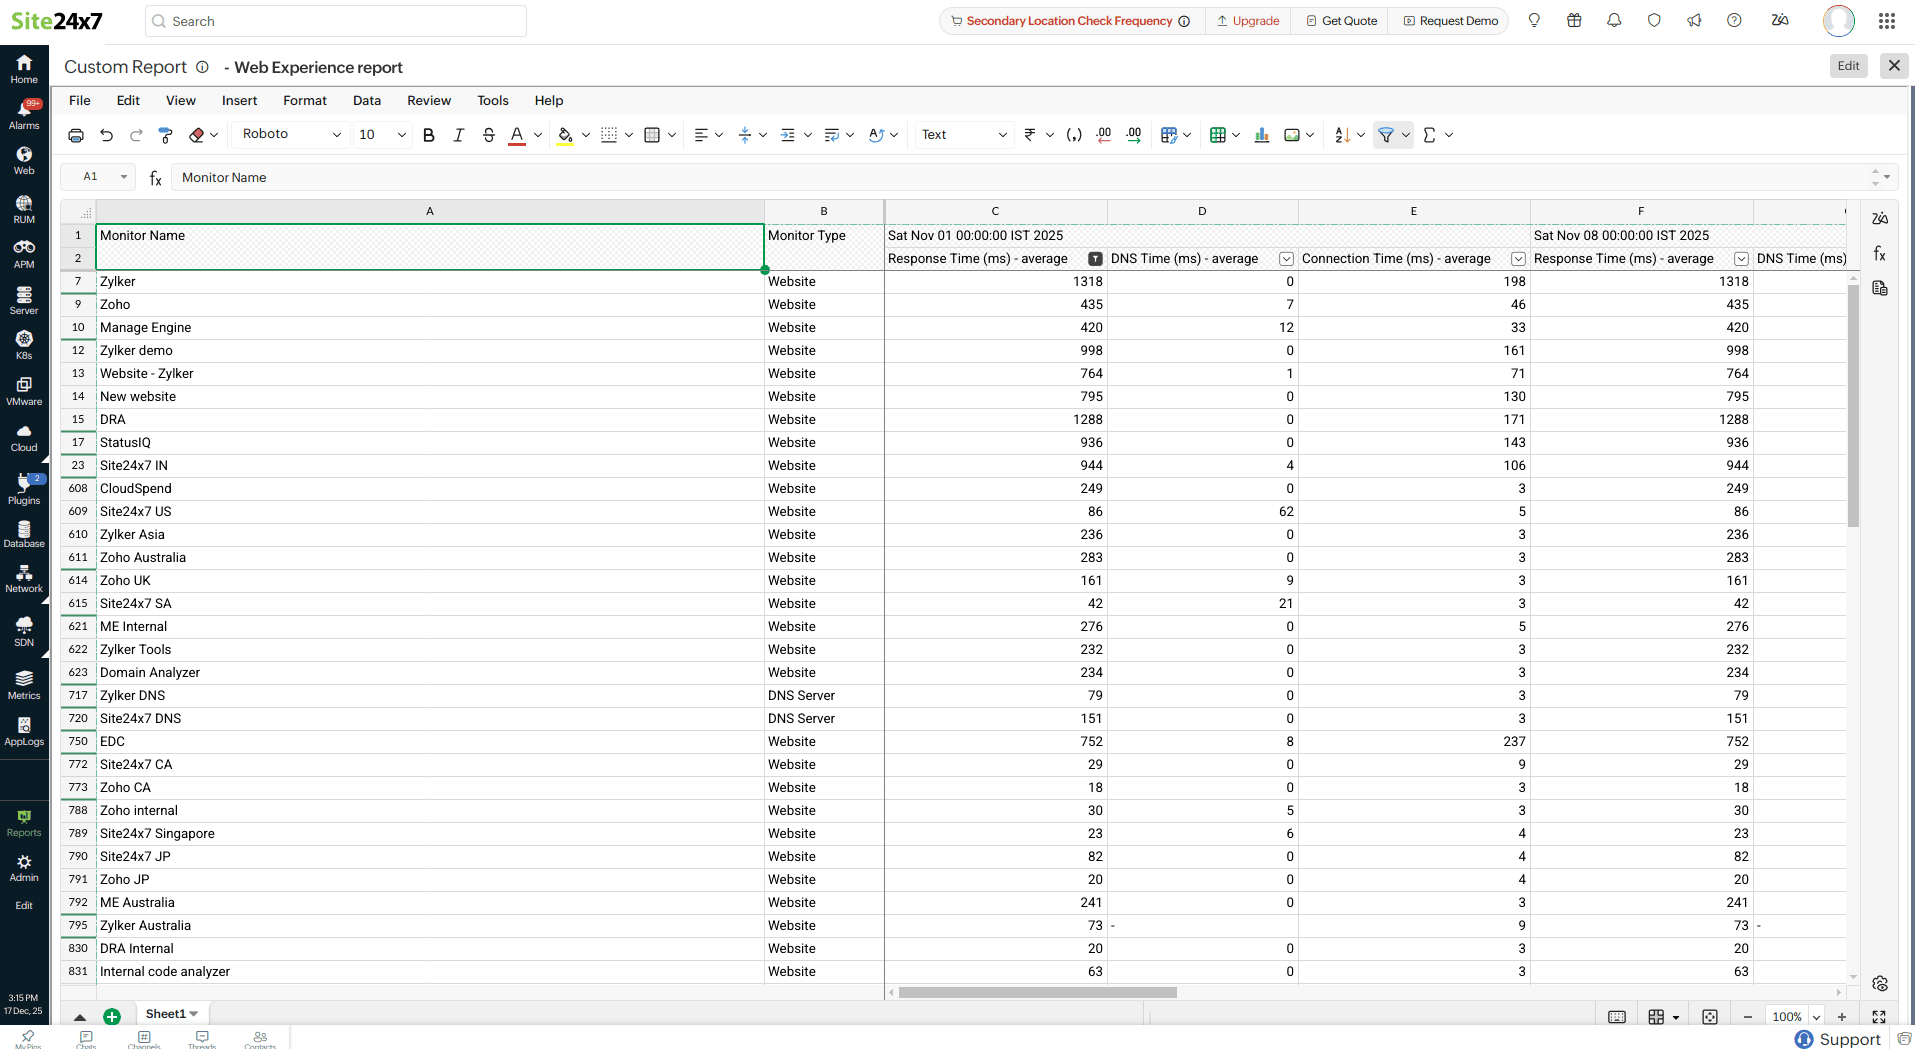
The custom report illustrates and renders the compared data in a tabular format. All the pre-selected performance attributes of your specified monitors will be listed in individual rows. You can view all the individual attribute values for selected time ranges listed under multiple columns against the monitor's & attribute's name. You can also add more monitor specific metrics for comparison. If you wish to share the report with a peer or customer, you can always generate a PDF of the report and share it with them. Click the Export PDF button to generate the PDF report. To delete the report altogether, just click Delete Report button listed on the top right corner.

 icon can be used to delete a specific column or row from the report.
- Row deletion removes the attribute associated with the monitor
- Column deletion removes the time period for all the monitors.
Click the  icon on the top right corner, to modify your existing time selection or add more time period ranges to the report. Again, a maximum of five time periods can only be accomodated in the view.
In addition to the exisiting set of time span selections in Site24x7, an all new set of time periods have been introduced for the Custom Report. They range from:
- Last 6 Hours (If time is currently 7 PM, it will return data from 1-7 PM)
- Last 12 Hours
- Last Hour
- 2 Hours Ago (If time is currently 7 PM, it will return data for 4-5 PM)
- 6 Hours Ago
- 12 Hours Ago
You can also generate the reports for custom time ranges using Calendar View. You can select both the dates in a single shot along with time, i.e, select both start date with time and end date with time (Example - Apr-2-2017 11 AM - Apr-11-2017 10 PM can be selected.)

Tutorial Video
Related Reading:
Custom reports
A custom report is a flexible reporting option with which you can meet your specific requirements. Instead of relying on predefined views, you can combine availability, performance, resource inventory, and monitoring inventory attributes in any order you choose and for any time period. You can summarize the report by applying aggregates, grouping similar entries, and using filters to focus on the most relevant insights.
Custom reports are ideal for identifying patterns, tracking trends, validating configurations, and getting a consolidated view of all your monitored resources in any required format.
Use cases
- Track the dependency between CPU Utilization and availability by selecting CPU Utilization, Total Downtime, Total Trouble Time, and Status for the last six months, and applying maximum aggregation on CPU Utilization to identify peak load periods aligned with downtime events.
- Monitor prolonged outages in internet service monitors by selecting Total Downtime and Status, setting the time period to the last month, and applying a condition to identify monitors with total downtime greater than five hours.
- Correlate server inventory details with disk performance and availability by selecting Resource Inventory attributes, disk-related performance metrics, and availability attributes for server monitors in a single report.
- Evaluate application user experience by selecting Apdex Score and Average Response Time, filtering Applications by a specific Monitor Group, and analyzing performance trends over the selected time period.
Creating a custom report
To create a custom report, follow the steps below:
- Log in to your Site24x7 account.
- Navigate to Reports > Custom Report > +Create Custom Report.
- In the pop-up that appears, select a Category to confirm the predefined group that organizes similar monitors. Once you select a category, all monitors belonging to that group will be automatically included in the report. For example, selecting Server as your Category will include all Agentless Servers and their instance monitors.
- Provide a Report name and Description by clicking the pencil icon
 . There are two stages in the report creation process:
- Once you customize the report, click Save to view it in Sheet View.
- Sheet View displays the report in a spreadsheet-like format, allowing you to use familiar formatting and data-handling features.
NoteAny changes made in Sheet View are read-only and will not be saved back to the custom report configuration.
- To modify the report configuration, click Edit Report and continue editing, or click the close button
 to return to the list page.
- To export the report, click Share This on the top-right corner. This option is also available on the Custom Reports list page within the hamburger icon
 next to the desired report. Choose one of the following options:
- Export CSV: Download the report in CSV format for further processing or to import it into another tool.
- Schedule Report: Set up periodic delivery of the custom report. Specify the required frequency and complete the form to create a report task that automatically emails the report to recipients.
- Email: Share the report instantly via email. Reports can be sent only to verified users who have opted to receive emails from Site24x7.
- Publish Report: Create a permalink for your custom report’s sheet view and share it with others. The Publish Report option is disabled if the report has already been published.
Selecting columns in a custom report
To select the required columns of your report, follow the steps below:
- In the left menu, in the Columns tab, click the pencil icon to include more columns in the report.
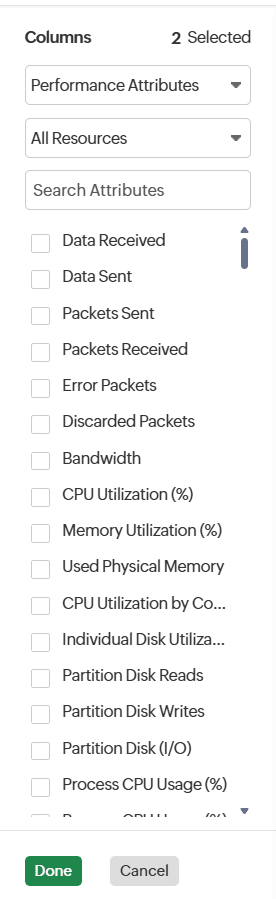
- In the Attributes and Resources drop-down menus, select the desired attributes and resources and click Save.
- Once the attribute is included, click the pencil icon near the attributes to aggregate them to their Minimum, Maximum, Average, or 95th Percentile value. This displays the least, peak, average, and 95th percentile values for the selected time range. Additionally, if required, you can rename the attribute name and click Save.
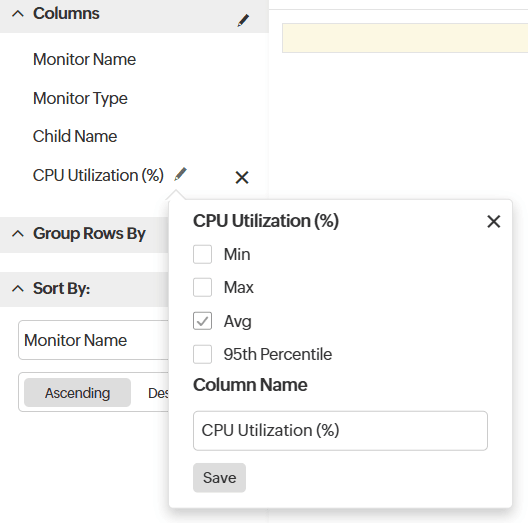
- In the Group Rows by section, click the pencil icon to cluster rows based on the selected column. For example, for the column Monitor Type, all monitors of that type appear as a grouped set.
- You can group the rows using Resource Inventory attributes or Monitoring Inventory attributes.
- You can select up to two attributes to group the rows.
- You can sort the rest of the columns using Sort by in ascending or descending order.
- Select the desired Time period.
NoteThe time period will be disabled if the report does not include any time-based attribute in the columns.
- Next, with the View by drop-down menu, select daily, weekly, or monthly intervals to view data in a more granular timeframe.
NoteThe View by option provides granular timeframe breakdowns and can be used only when the selected Time Period is one month or longer.
- Next, organize the data with Group Columns by based on either by time intervals or by attributes.
- If you group by attributes, you can view the attribute data across multiple timeframes collectively.
- If you group by time period, you can view different attribute data for the time interval you have selected in the View by option.
NoteGroup Columns by is disabled if the View by option is not selected.
Applying filters in a custom report
Once the required columns are selected, you can apply filters to include granularly refined data in your report.
In the left menu, in the Filter tab, there are two filters:
- Use the Inventory Filter to filter monitors based on Monitoring Inventory attributes.
- You can add up to five conditions and combine them using logical expressions, such as a && b.
For example, use condition a in the Monitoring Inventory to filter monitors assigned to the Production Monitor Group, and condition b to filter monitors that use a specific Threshold Profile. The report will include resources that match both conditions within the Monitoring Inventory.
Use the Data Filter to filter metric-based attributes. You can add up to five conditions, which are combined using the AND logical operator.
For example, use condition a to filter Response Time above 400ms and condition b to filter DNS Time above 200ms. The report will include resources matching both the conditions.