Monitoring tabular performance counters
You can monitor the tabular SNMP object identifiers (OIDs) of your network devices using tabular performance counters. Categorize and view all your group-based performance metrics in a unified table in Site24x7.
What are tabular performance counters used for?
They monitor tabular OIDs. Take a look at some use cases to better understand tabular performance counters.
How do I add tabular performance counters?
You can add tabular performance counters in a few different ways:
- While adding device templates
- While editing device templates
- From the Performance Counters tab
- From the Tabular Performance Counters tab
To add tabular performance counters while adding device templates:
- Log into your Site24x7 account.
- Navigate to Network > Device Templates.
- In the Device Templates screen, click Add Device Template, located at the top right corner of the screen, and enter the following:
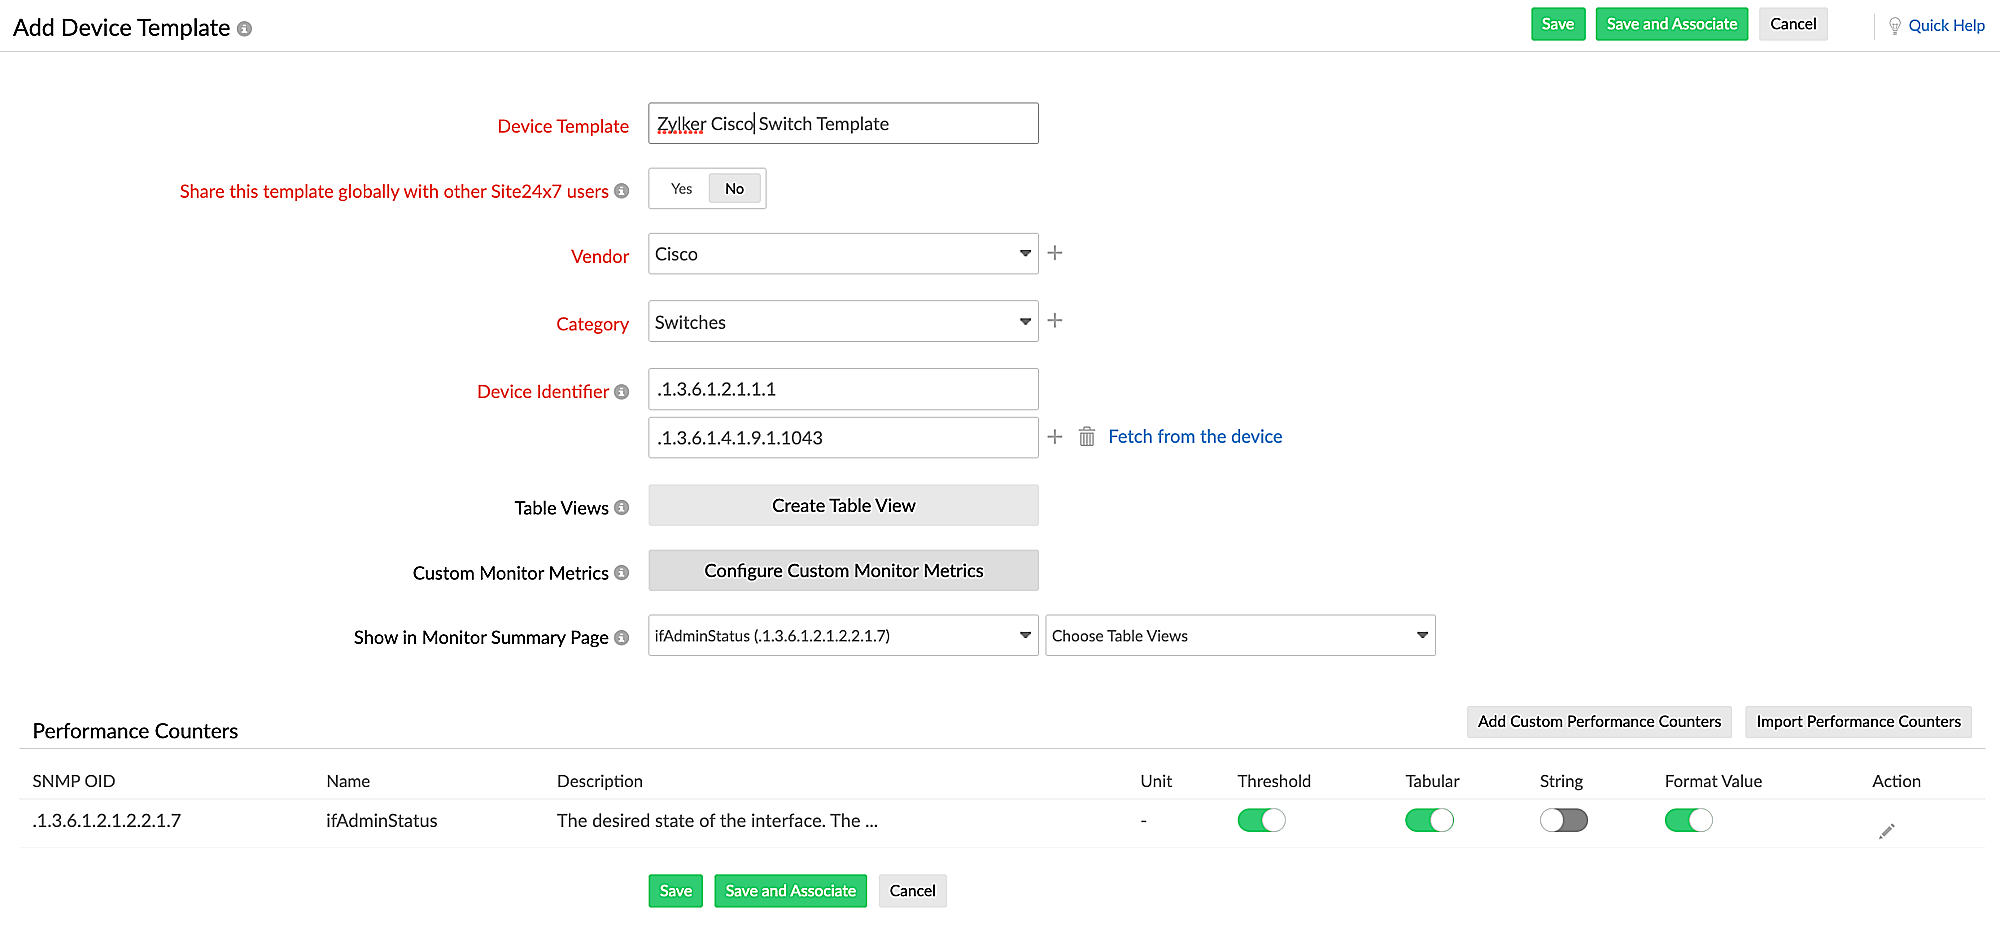
Figure 1. Add Device Template Screen.- Device Template: Provide a name to identify the template.
- Share this template globally with other Site24x7 users: Toggle Yes if you wish to share your custom template across Site24x7 users.
- Vendor: Pick a vendor from the drop-down menu or add one by clicking +.
- Category: Choose the category that the device belongs to. You can also add a new custom category by clicking +. In this case, you'll have to add a Parent Category first, and then the custom Category will be a sub-type of the Parent.
NoteThe device will be classified based on the Category or the Parent Category. For instance, if you select Desktop, Server, or Domain Controller in the Category or the Parent Category, the device will be categorized as an agentless server. If you select any other option, the device will be categorized as a network device. - Device Identifier: Enter the System Object Identifier (SysOID).
- Performance Counters: To add custom performance counters, click the button. Then, click on the Tabular tab.
MIB Browser
A management information base (MIB) is a structure that defines the format of information exchange in an SNMP system. You can add performance counters from generic MIBs or custom MIBs.
- Generic MIBs: These are available by default in Site24x7. Select the Vendor and the MIB from the drop-down list.
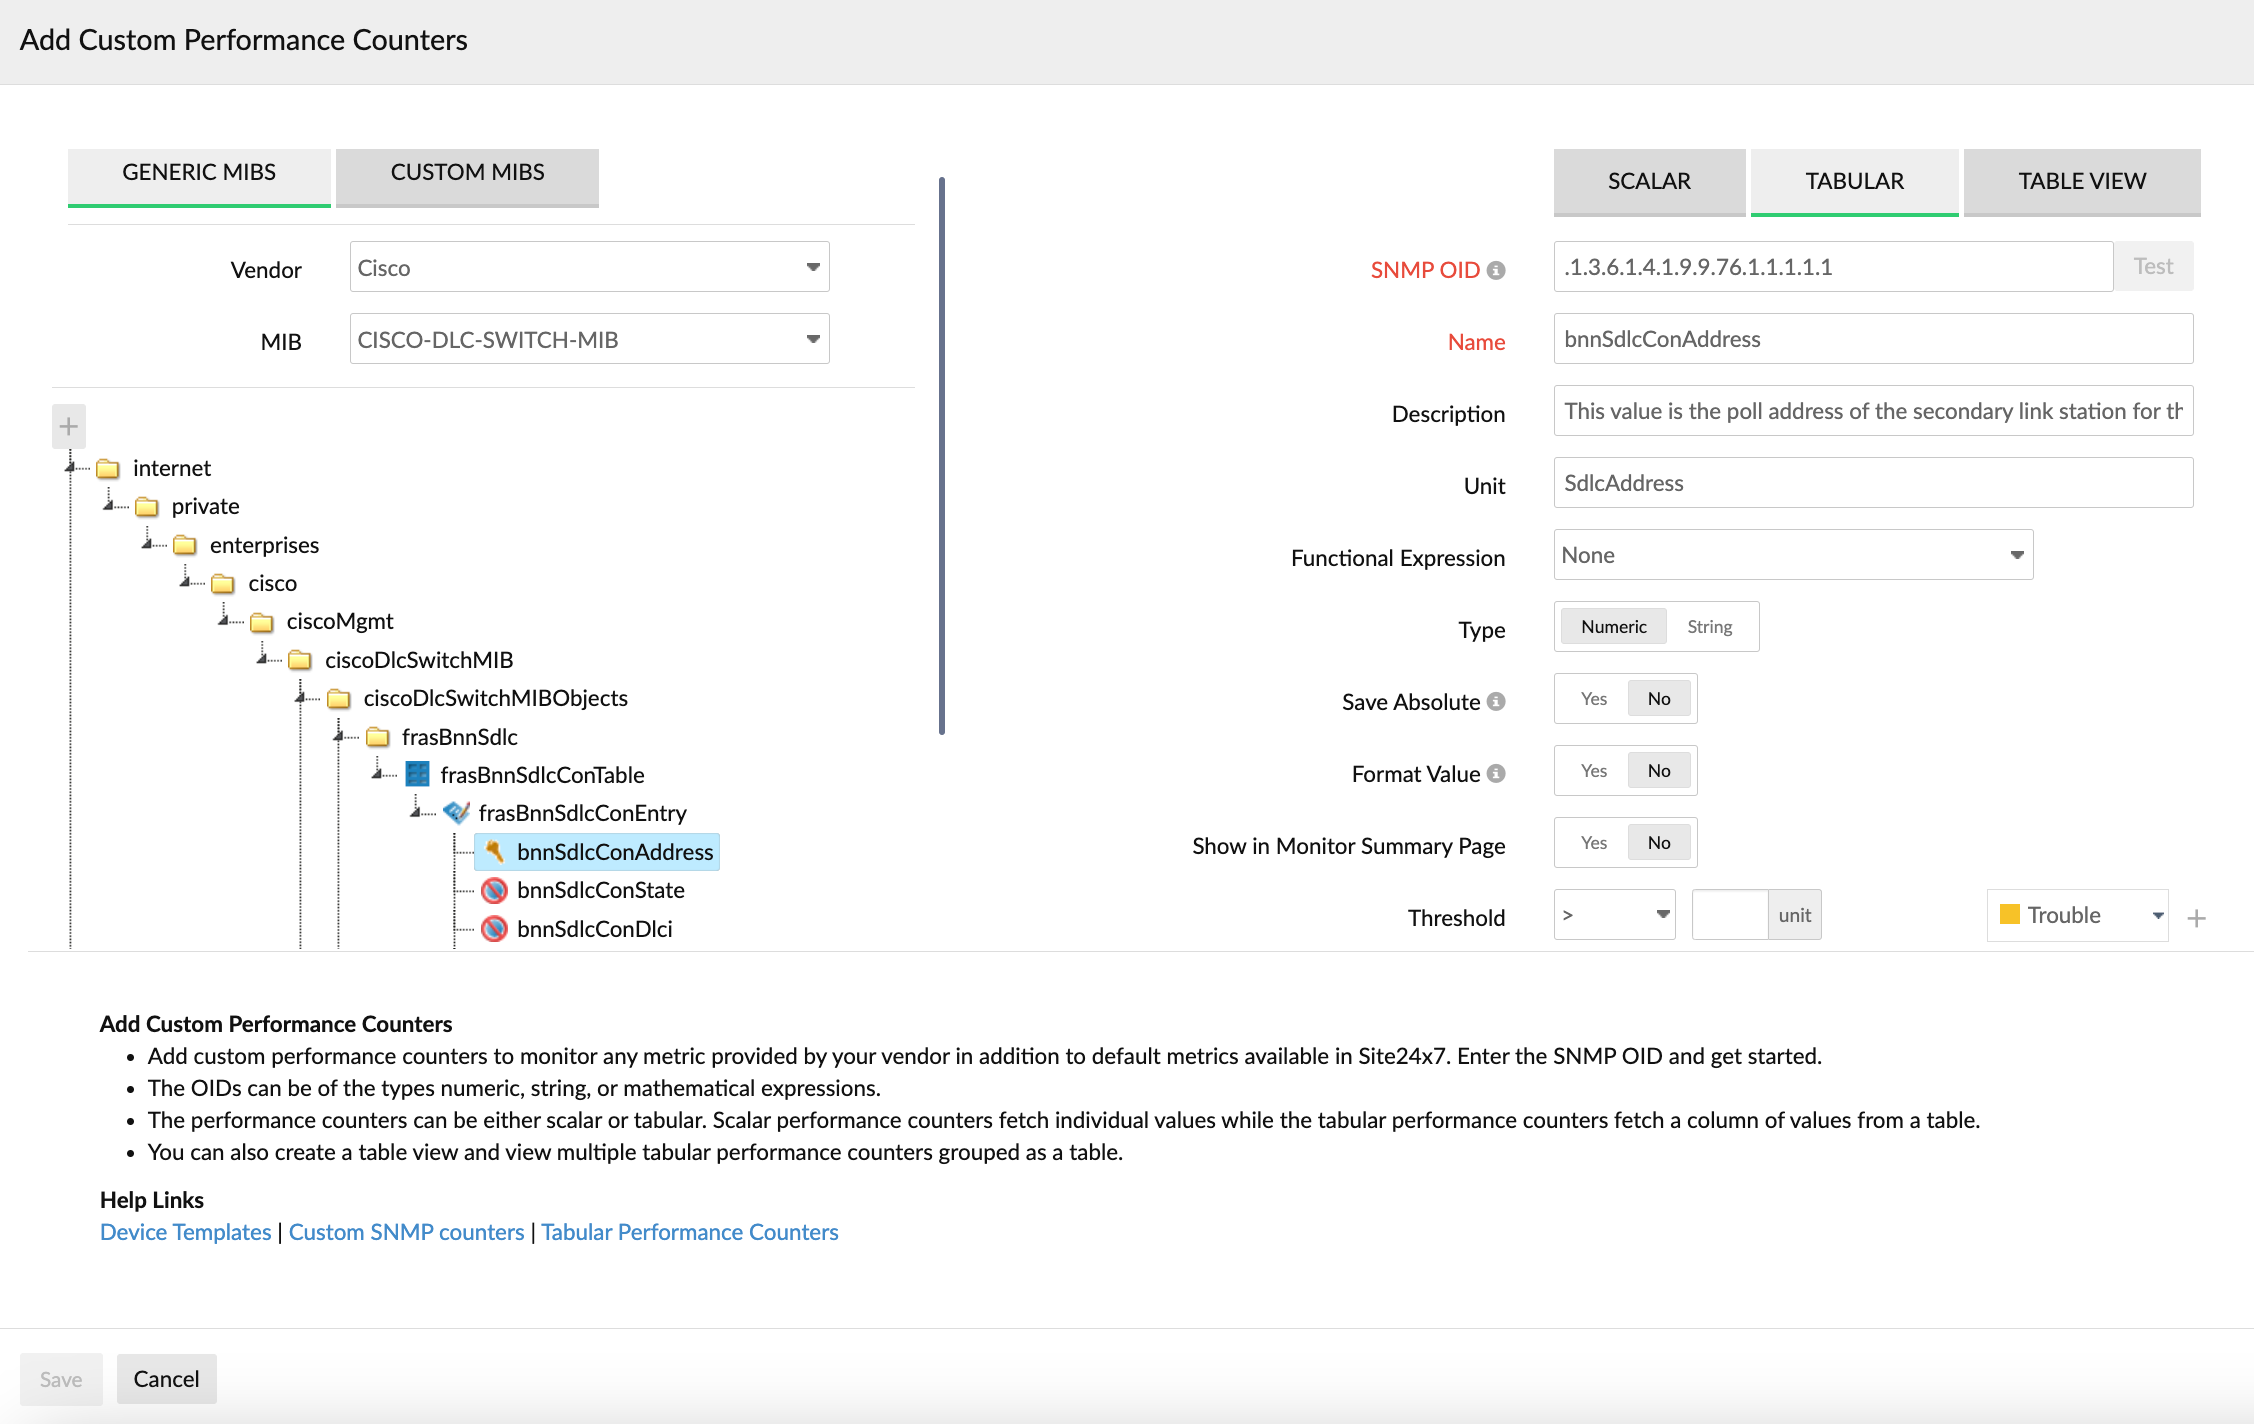
Figure 2. Add Custom Performance Counters pop-up. - Custom MIBs: You can upload MIBs from your system and use them to add custom performance counters.
- On-Premise Poller: Choosing an On-Premise Poller will list all the MIBs inside the folder Poller-home/NetworkPlus/mibs. Choose the On-Premise Poller which stores the MIB files you uploaded. If you choose Recently Viewed, all the MIBs that were uploaded or recently used will be shown.
- MIB: Choose a previously uploaded MIB from the drop-down menu or click + to add new ones.
In the Upload MIB screen, select files and upload them from your computer. Also, choose the On-Premise Poller which has to store the MIB files.

Figure 3. Upload MIB pop-up.
Tabular Performance Counters
In the TABULAR tab on the right-side pane, enter the values for the SNMP OID, Name, Description, Unit, Functional Expression, Type, Save Absolute, Format Value, and Show in Monitor Summary Page fields. You can either enter them manually or use the built-in MIB browser to do the same. By selecting a table on the MIB, you can directly create a Table View which includes all the corresponding tabular performance counters.
- Select Yes for the Show in Monitor Summary Page field if you wish to show the performance counters on the monitor summary page.
- Unit: Enter the unit of the performance counter to be displayed on the alerts.
- Functional Expression: Select an option from the drop-down menu to convert the performance counter value to the appropriate metric—for example, Bytes to kB (Fig. 4).
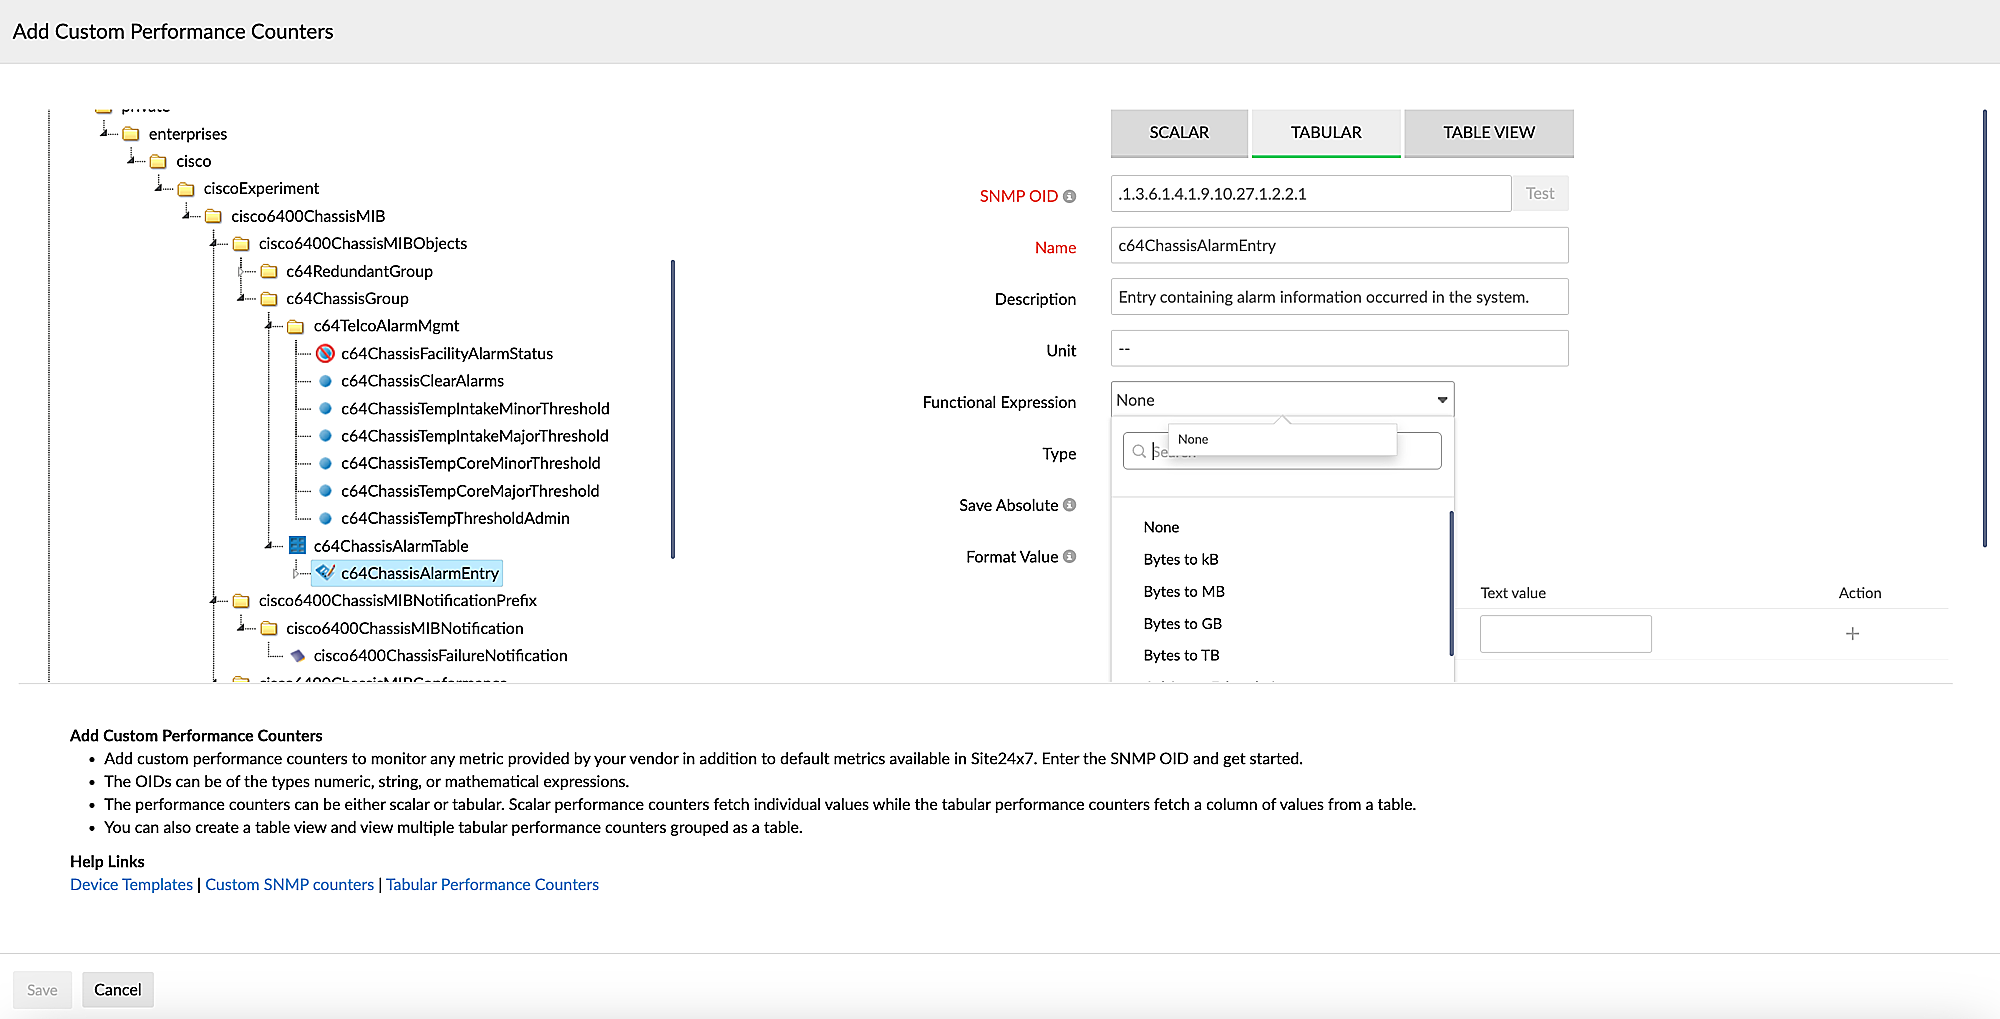
Figure 4. Selecting an option for Functional Expression. - Type: If the value fetched by the SNMP OID is numerical, then select Numeric for the Type. Otherwise, select String. Please use the Test button (as explained in the Import Performance Counters subsection of this help doc) to verify the type of value returned (Fig. 5, marked as 1).
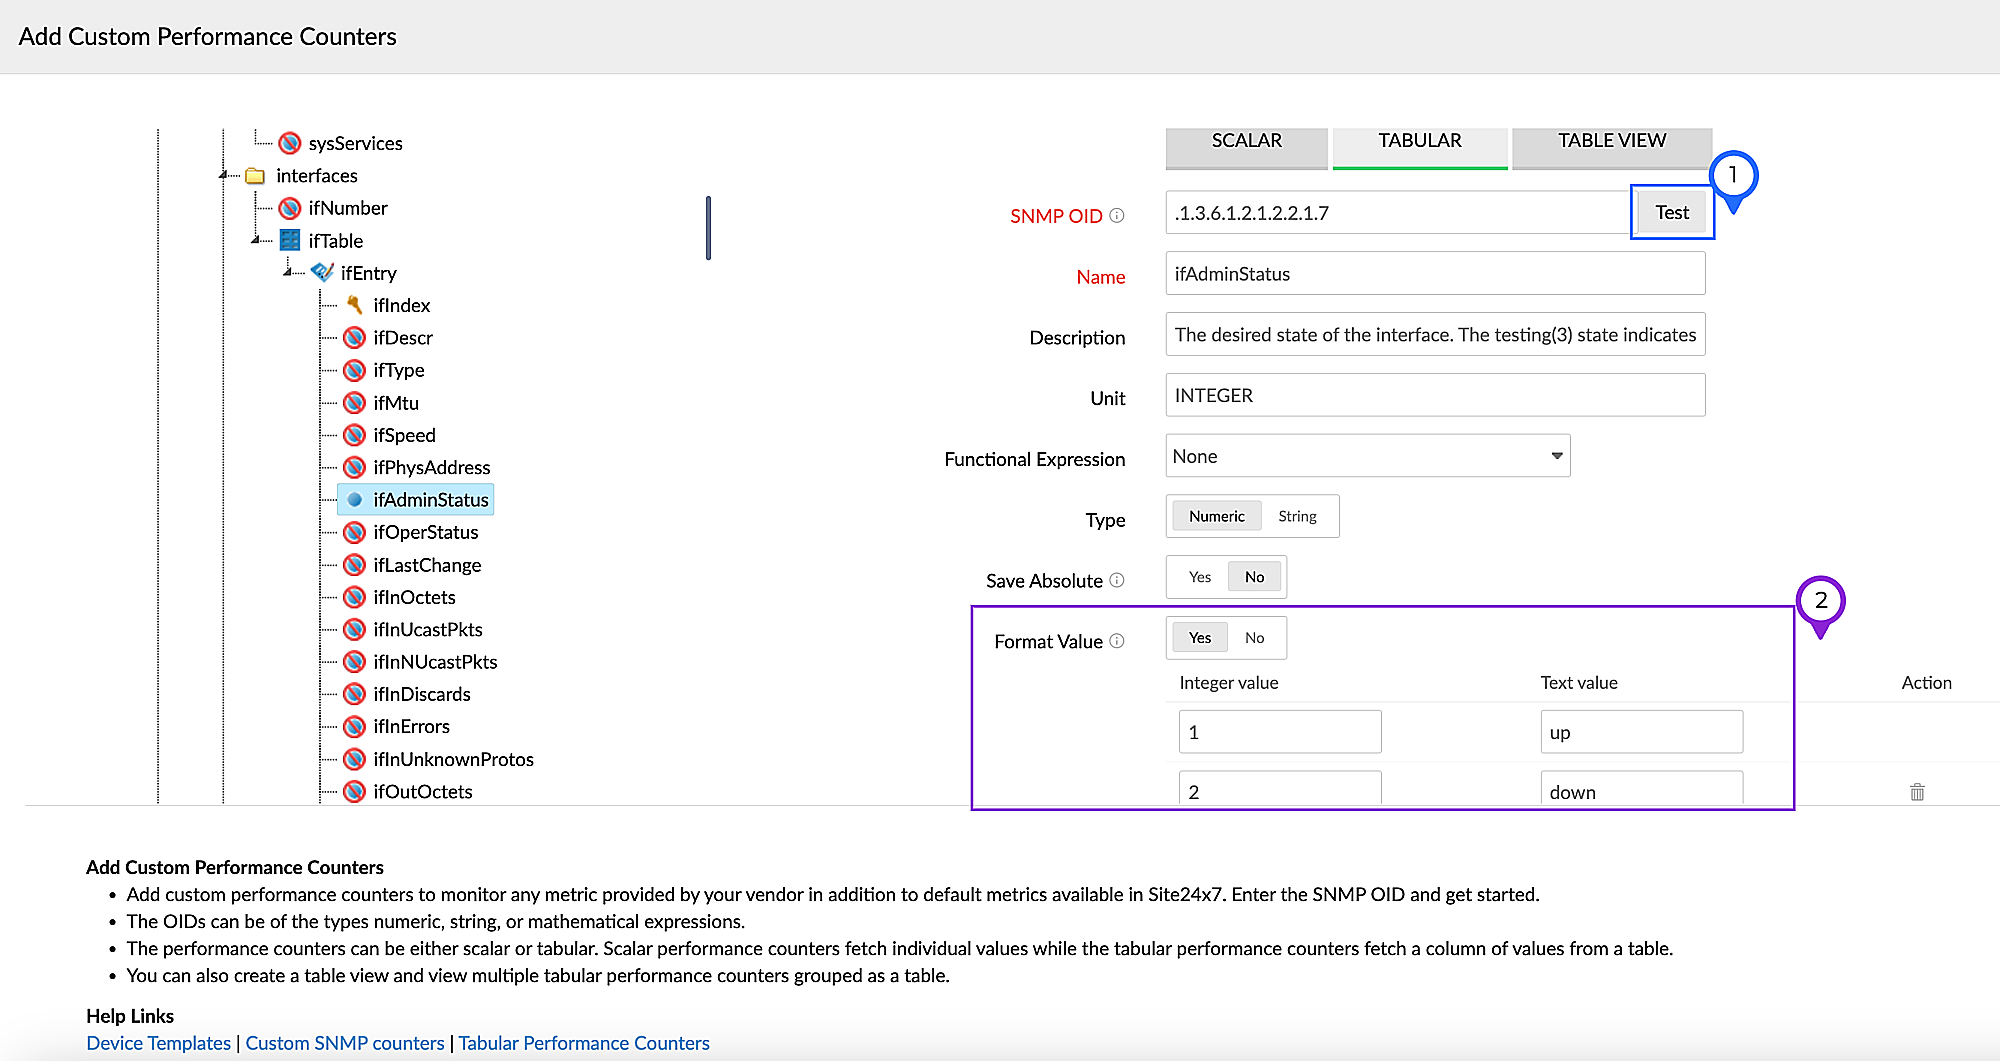
Figure 5. Adding tabular performance counters. -
Save Absolute
This option is available for scalar and tabular performance counters and is useful for OIDs that are like counters for a specific metric. A counter-type OID is an OID that keeps incrementing until its limit is reached. It then resets, and it continues to increase.
An example of this is ifInOctets (.1.3.6.1.2.1.2.2.1.10), which represents the total number of octets received on the interface. When queried, this OID will return the overall number of octets received in the particular interface. The value keeps increasing over time, as it is a counter. in each poll is displayed. Otherwise, the difference of the PDUs between each poll is indicated.
If you set Save Absolute to No for this OID, then the difference between the last two polls will be calculated and displayed as the value. However, if Save Absolute is set to Yes, then the absolute value will be displayed.
Note If the OID's Unit (or syntax in MIB file) is Counter, toggling to No fetches the value as the difference between the last two polls. Toggling to Yes gets the absolute value received in each poll.
If the OID's Unit (or syntax in MIB file) is Integer, toggling to Yes fetches the value as the difference between the last two polls. Toggling to No gets the absolute value received in each poll.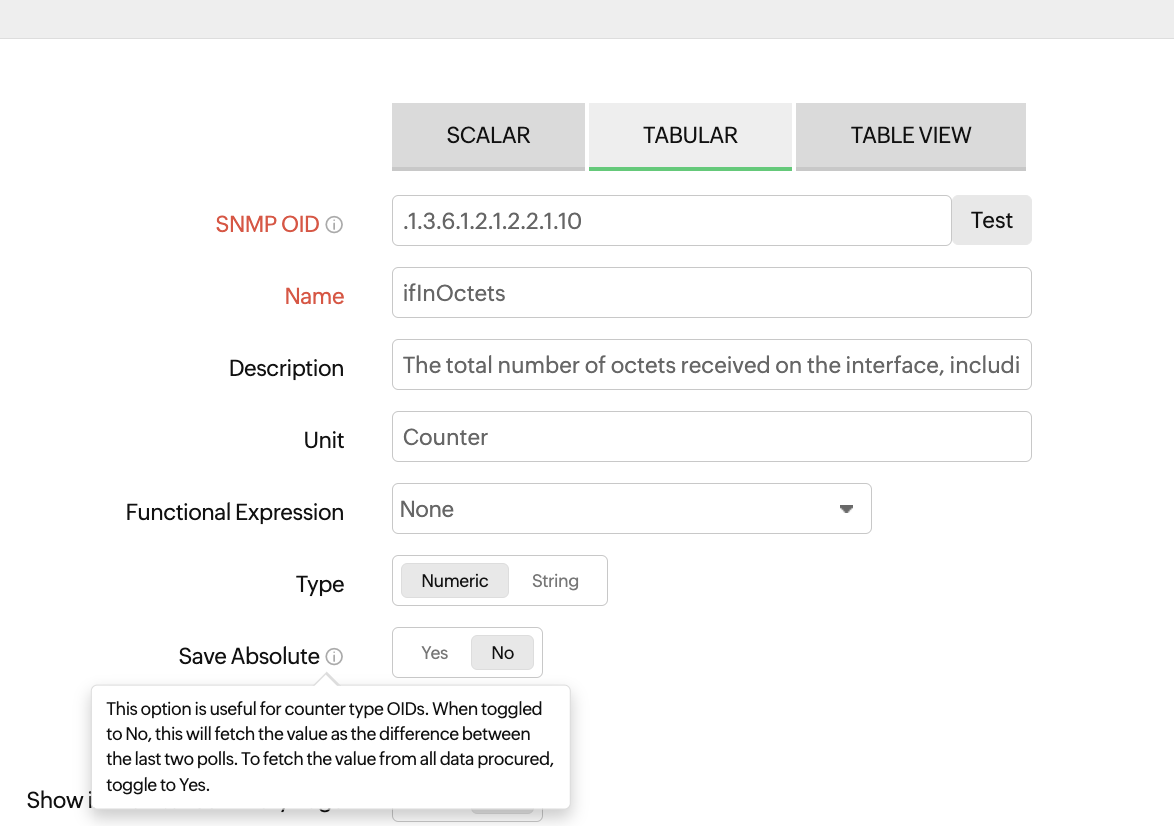
Figure 6. Save absolute for counter type performance counter.Consider two performance counters for the ifInOctets OID, with the Save Absolute value set to Yes for one and No for the other.
These are the actual SNMP query responses for the OID over 15 minutes.
03:00:00 - .1.3.6.1.2.1.2.2.1.10.1 -> 10000
03:05:00 - .1.3.6.1.2.1.2.2.1.10.1 -> 15000
03:10:00 - .1.3.6.1.2.1.2.2.1.10.1 -> 18000Value for the performance counter with Save Absolute set as Yes
03:00:00 -> 10000
03:05:00 -> 15000
03:10:00 -> 18000Value for the performance counter with Save Absolute set as No
03:00:00 -> No data (as there is no previous poll to calculate the difference)
03:05:00 -> 5000
03:10:00 -> 3000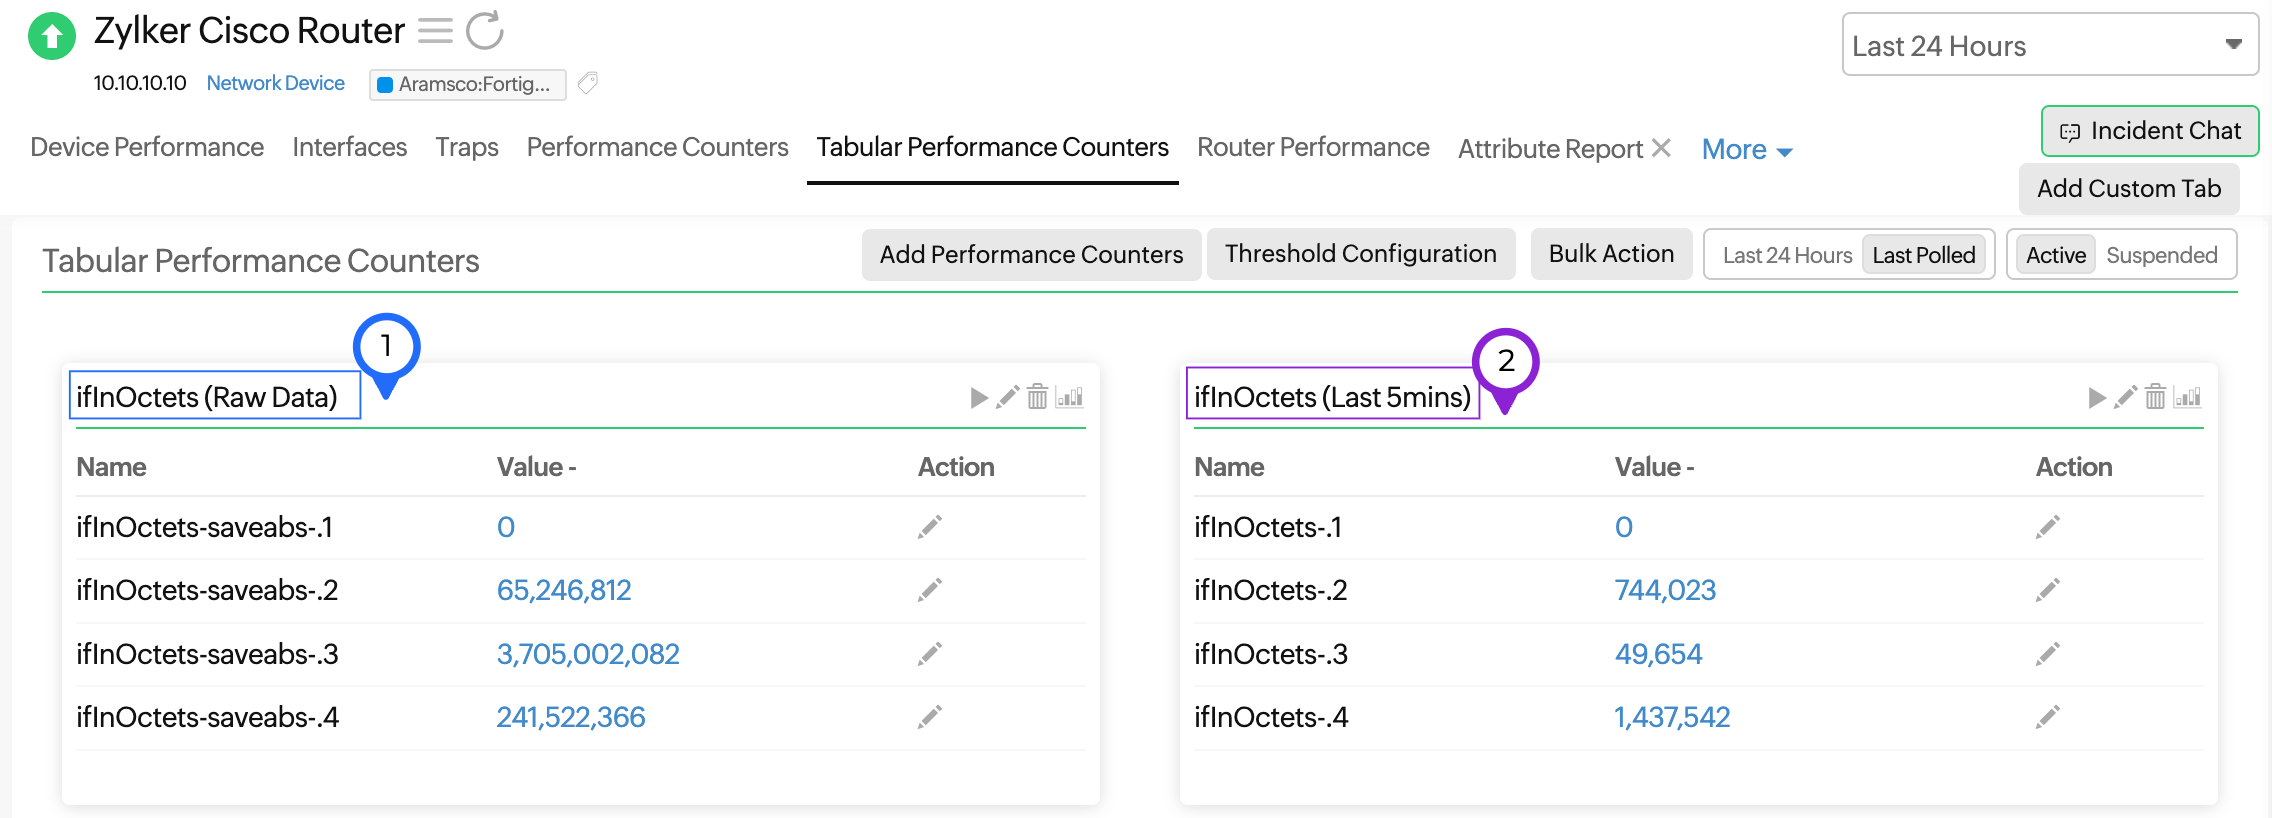
Figure 7. Value difference based on Save Absolute. - Format Value: Selecting Yes allows you to provide a meaningful description for an integer value. For instance, if the admin status is returned as a numerical value, then the display value can be provided as Up or Down instead of showing the number in the alert message (Fig. 5, marked as 2).
- Show in Monitor Summary Page: Selecting this allows you to view the performance counters that will be displayed on the monitor summary page.
- Threshold: Enable alerts on any breach of predefined conditions that you set.
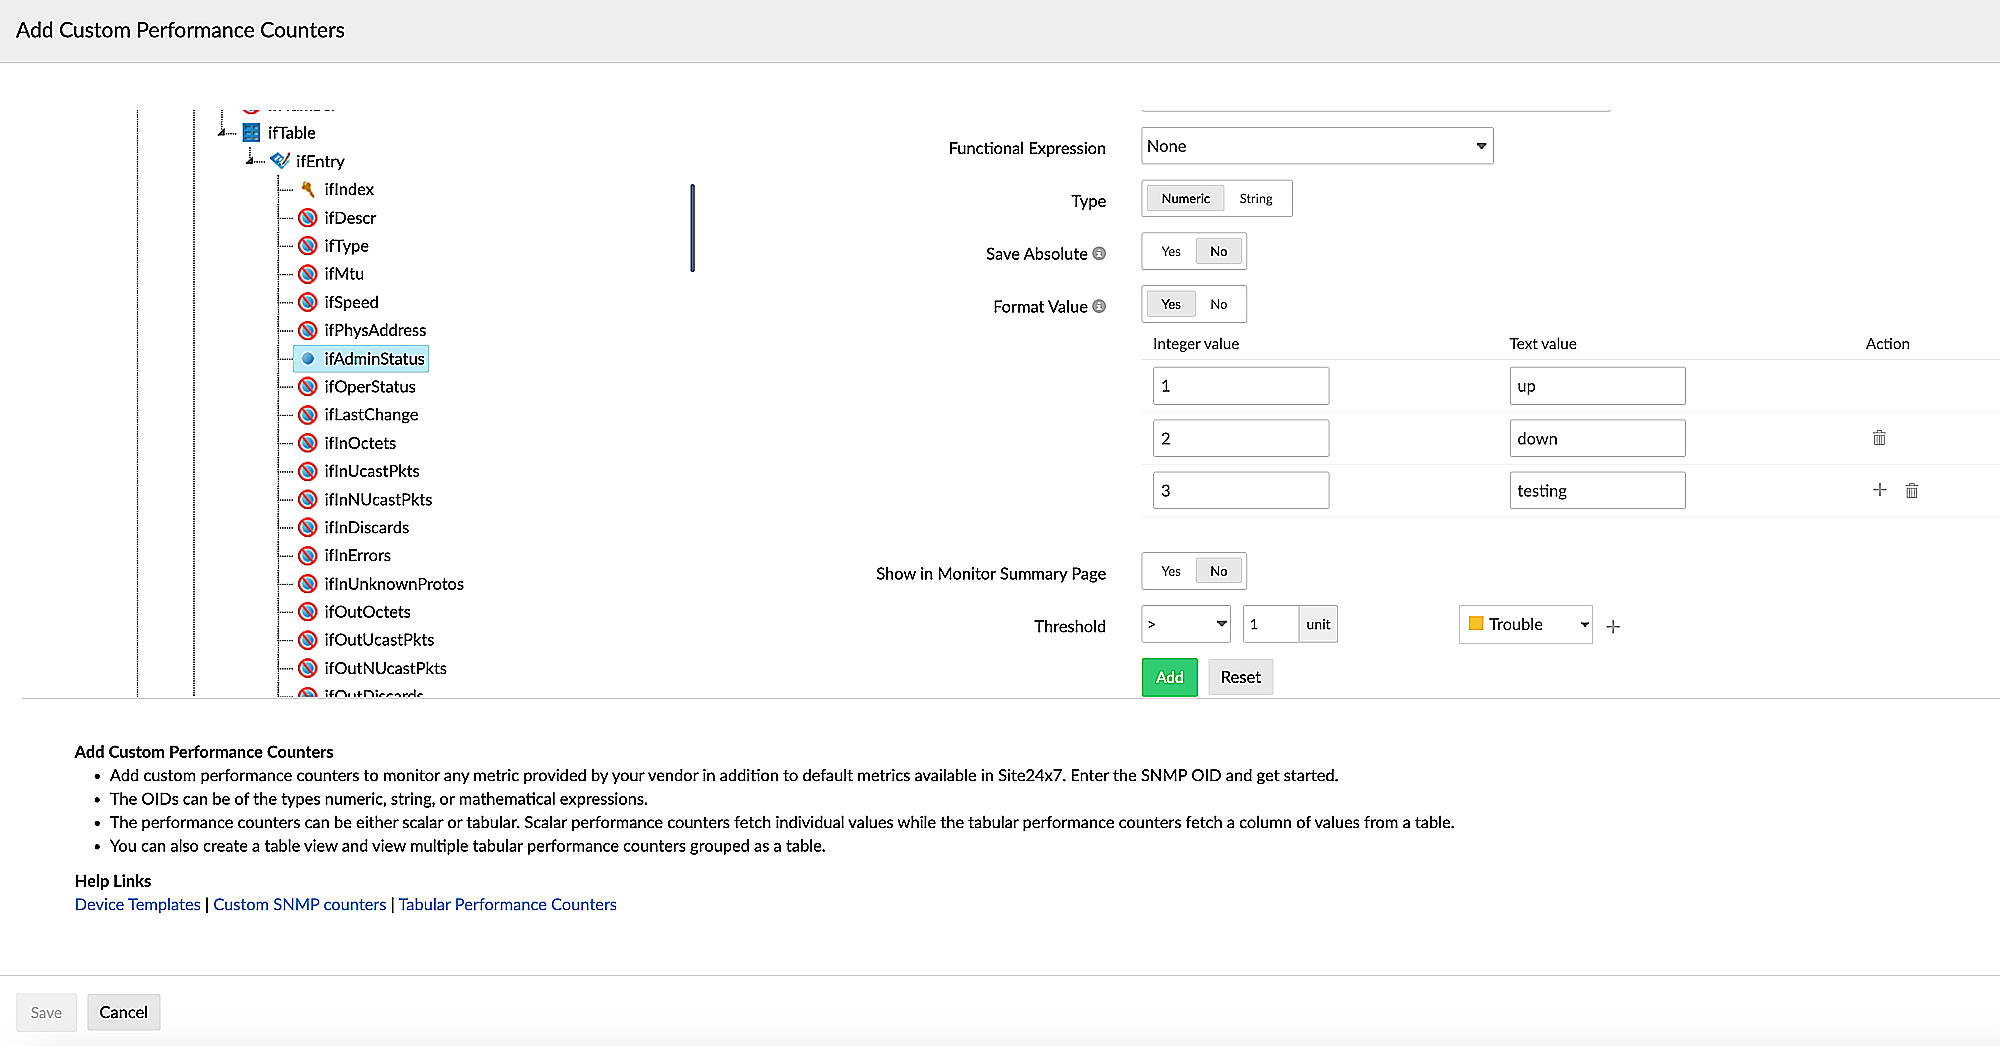
Figure 8. Setting thresholds in Add Custom Performance Counter pop-up.
Table View
A table view displays the selected performance counters as a table. Provide a name, and choose the tabular performance counters that have to be displayed as individual columns in a table. You can also choose a table directly from the MIB and view it here.
- Show in Monitor Summary Page: Toggle Yes to choose if the performance counter has to be displayed on the monitor summary page.
- Show Index Column: Toggle to Yes to show the index column on the Tabular Performance Counters screen.
- In theTabular Performance Counter section, select Add to Table View to view the performance counter on the table view or delete the record if it is not required on the view.
NoteA table can contain a maximum of nine columns. The rest of the selected counters will be added as individual tables. - Column of the Table View to be displayed in the Alert: Choose a column name to include in the alerts generated, so that you'll obtain a clear picture of which tabular performance counter in the table has generated alert.
Consider a table view with two tabular performance counters (columns) named "Sensor Failures" and "Sensor Description". If you choose the column "Sensor Description", then your alert will be: Sensor Failures-.3 for (Power Supply 2 Sensor) exceeds 5 units. - Click Add. Then, click Save.
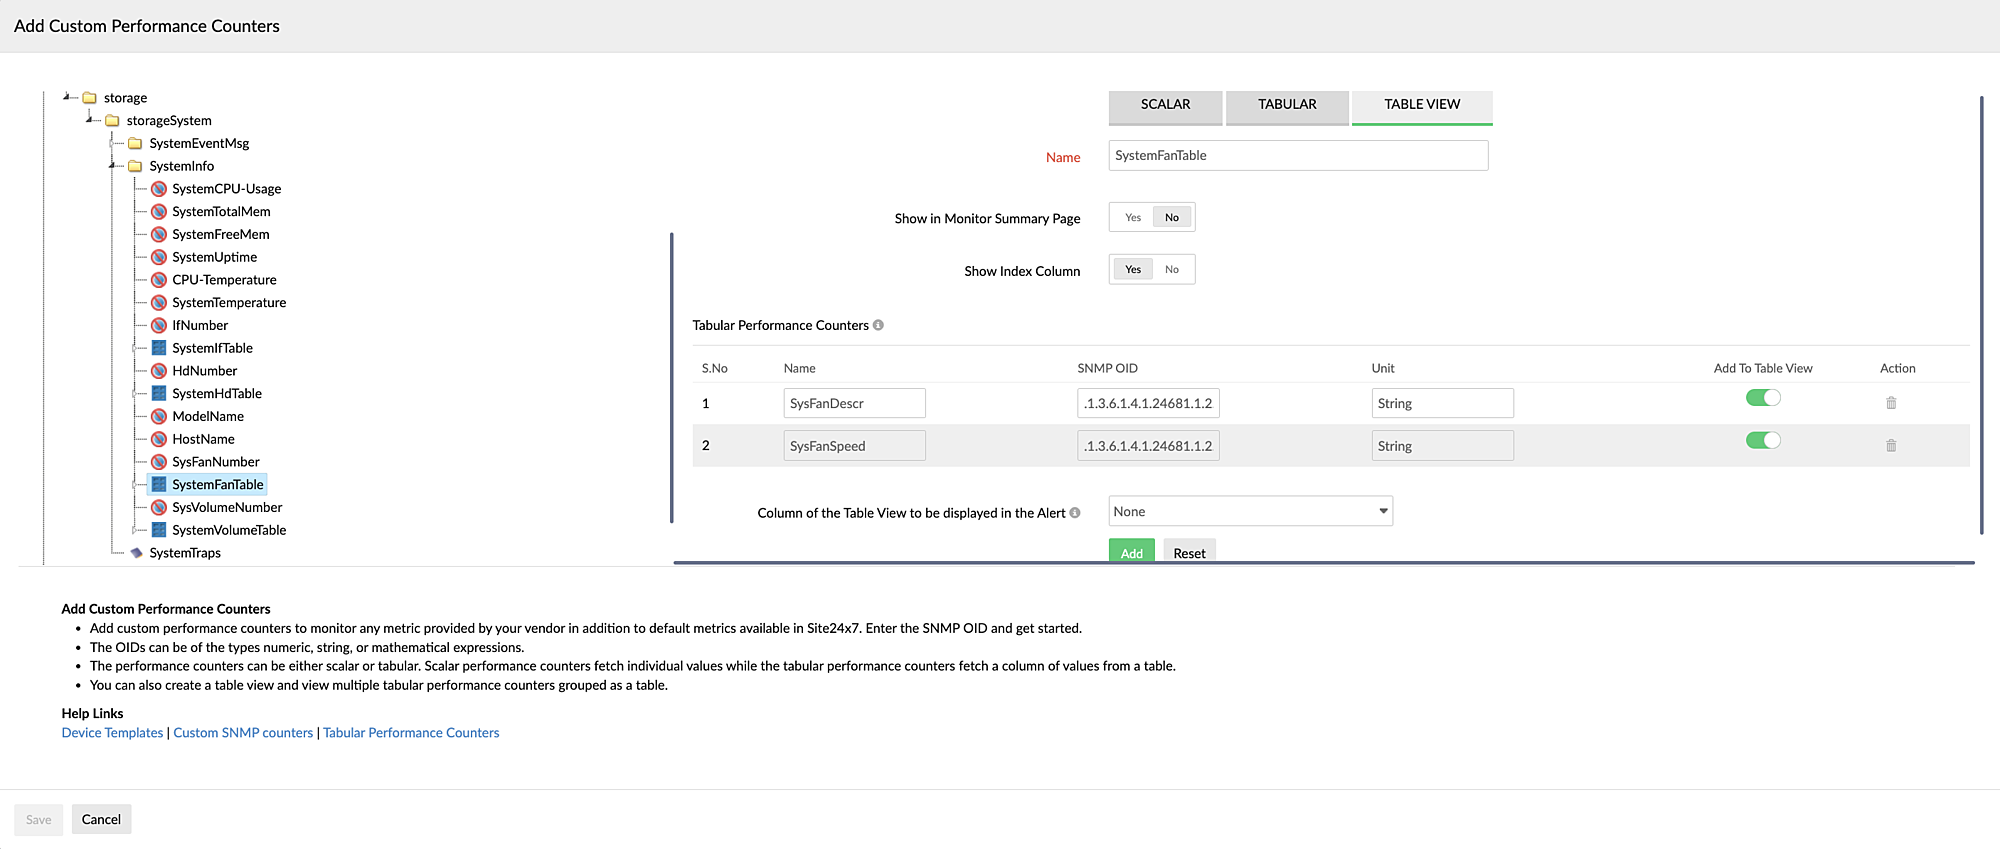
Figure 9. Adding performance counters to Table View.
- Generic MIBs: These are available by default in Site24x7. Select the Vendor and the MIB from the drop-down list.
- Custom Monitor Metrics: You can configure monitor-level metrics for your device type by providing a custom performance counter. Click Configure Custom Monitor Metrics. On the Custom Monitor Metrics screen, select the custom metrics for the performance counters of CPU Utilization, Memory Utilization, Manufacturer, Serial Number, Model Name, System Uptime (hours), and Firmware Version from the drop-down menus (Fig. 10). You can also click the Test button for each to see if the right value is fetched before adding it.
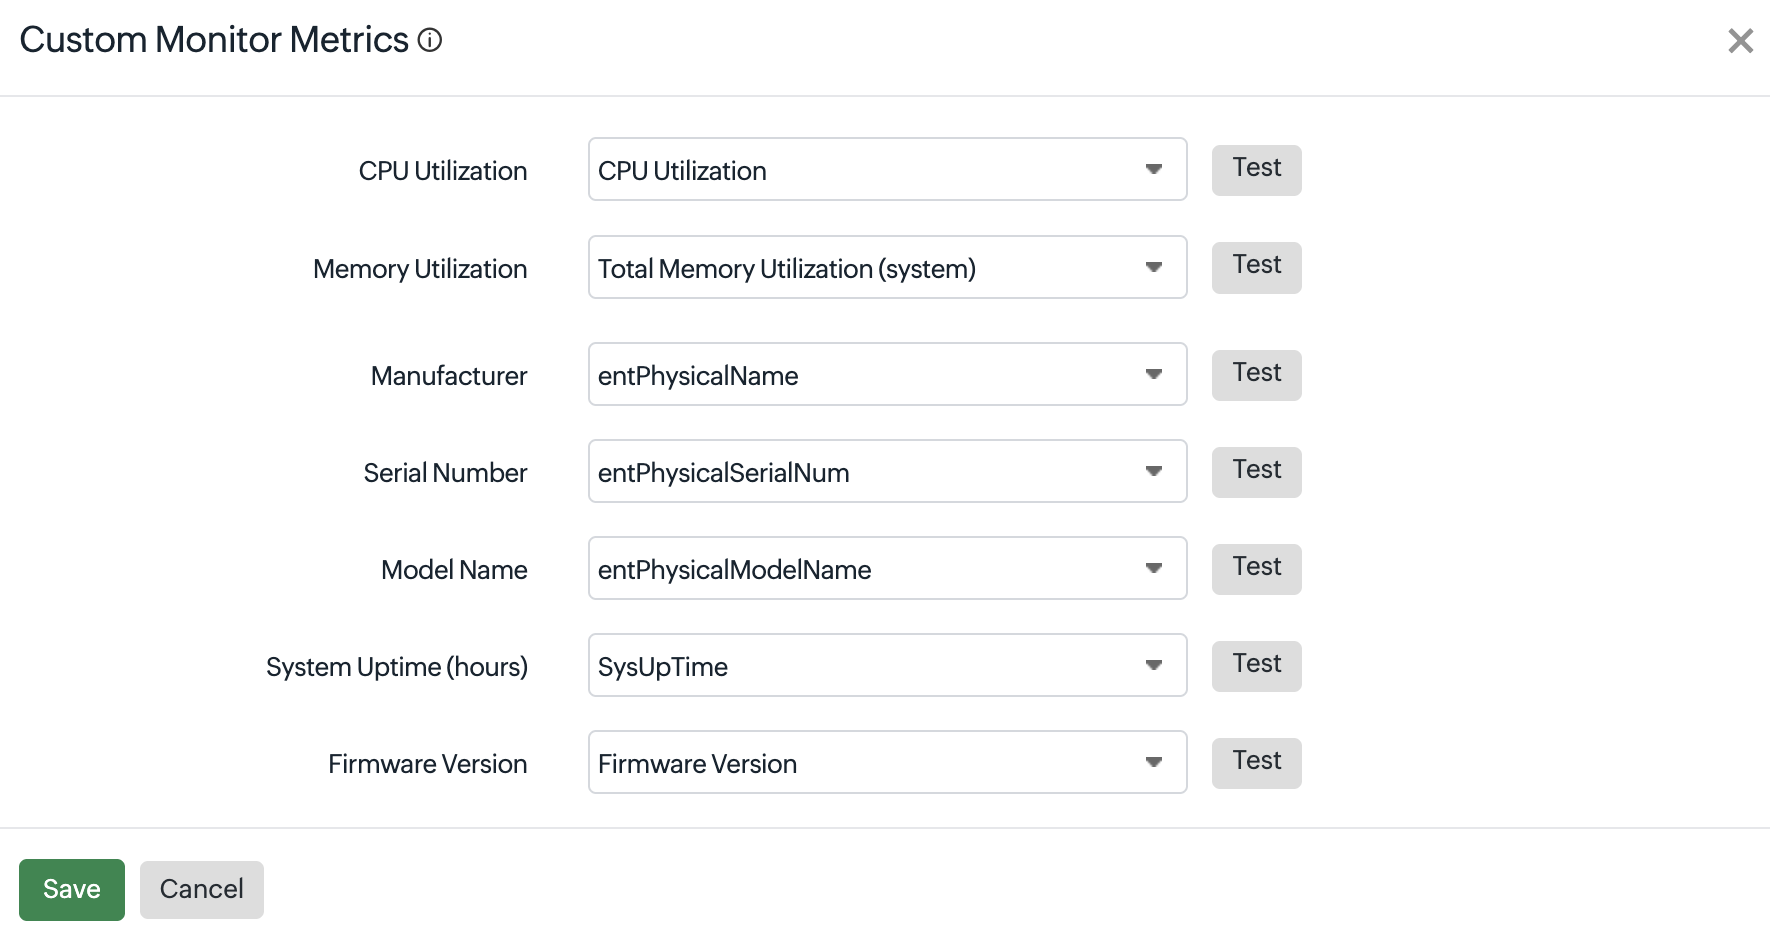
Figure 10. Configuring custom monitor metrics.NoteCPU Utilization and Memory Utilization can only be numeric values, while the rest can be either numeric or a string. -
Import Performance Counters
You can also import the performance counters available in other device templates by clicking the Import Performance Counters button.
- Select the performance counter you want to import from Generic, Custom, or Global templates on the Import Performance Counters screen. Then click Import. You can now see the performance counter has been added to the device template.
- To verify that the performance counter can fetch data for your device, click the pencil icon
 beside it.
 - Click Test beside the SNMP OID field on the Edit Custom Performance Counter screen.
- On the Test Performance Counter screen, select an option in the Test using field.
- If you select Monitor Name(Fig. 11):
- Select an option for Monitor Name from the drop-down menu.
- Select the credential in the Credential Name field.
- Verify the SNMP OID and the Type of the performance counter.
- Click Test.
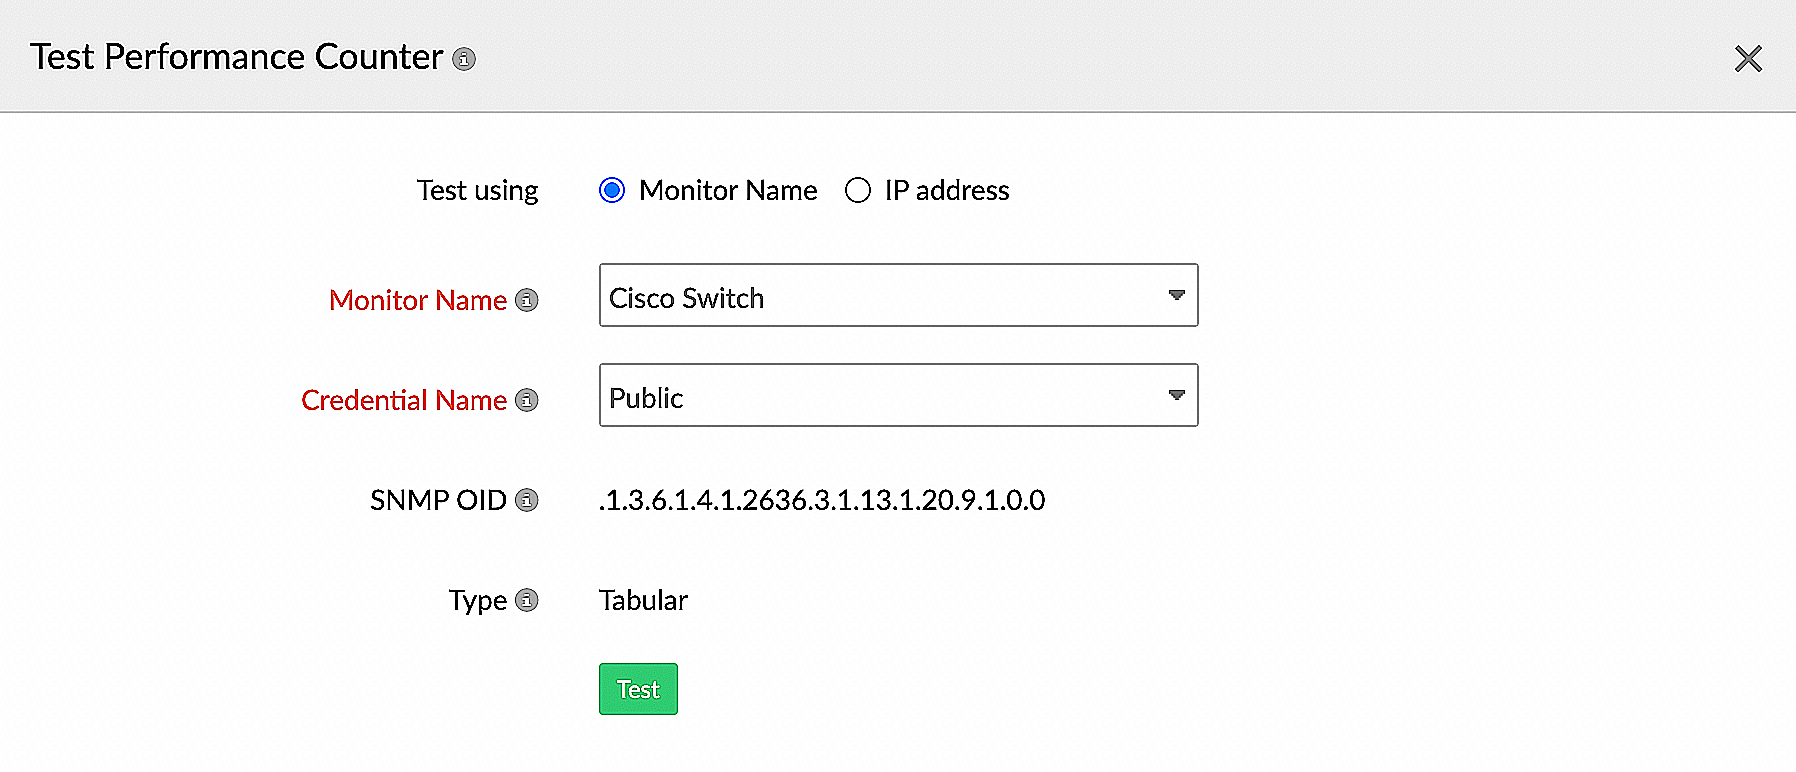
Figure 11. Testing a performance counter with the monitor name.
- If you select IP address(Fig. 12):
- Enter the value in the IP address field.
- Select the correct On-Premise Poller.
- Select the credential in the Credential Name field.
- Verify the SNMP OID and the Type of the performance counter.
- Click Test.
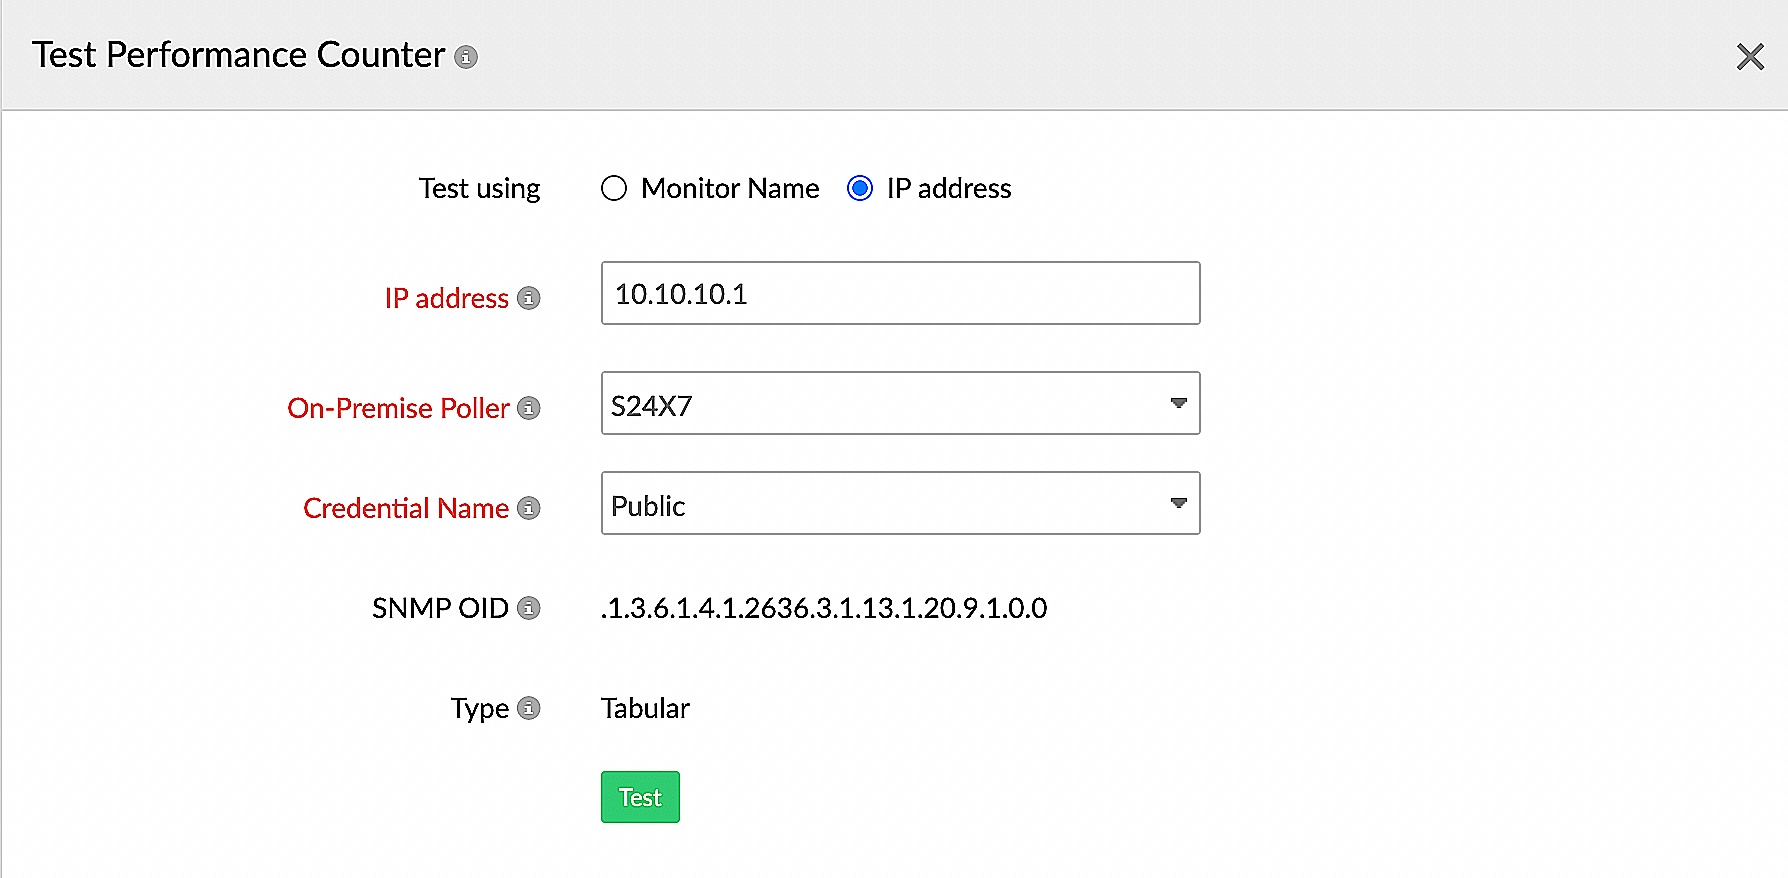
Figure 12. Testing a performance counter with the IP address.
- Table View: View a consolidated table of tabular performance counters that you added to the table (while adding custom performance counters). You can create an all new Table View from here, if you haven't created one yet.
- Show in Monitor Summary Page: Double-check your entries from the Add Performance Counters tab. You can also add more to your desired performance counters and tables, and view them on the monitor summary page
- Click Save to save the custom template. Click Save and Associate to associate the template to a set of network devices.
To add tabular performance counters while editing device templates:
-
- Click Network > Device Templates.
- In the Device Templates page, click the pencil icon under Action against the template that needs to be edited.
- Once the Edit Device Template window pops-up, modify the existing parameters.
- Follow steps 3-7, as above to edit any of these fields.
- Select the required devices under Apply to Associated Devices, in order to apply the changes to the existing devices.
- Click Save to save the custom template. Click Save and Associate to associate the template to a set of network devices.
To add tabular performance counters from the Performance Counters tab:
-
- Go to Network tab and click on the name of the device you'd like to add performance counters for.
- In the device dashboard that opens, click on the Performance Counters tab.
- Click on the Add Performance Counters button.
- Check the performance counters you'd like to add and click Save.
To add tabular performance counters from the Tabular Performance Counters tab:
-
- Go to Network tab and click on the name of the device you'd like to add performance counters for.
- In the device dashboard that opens, click on the Tabular Performance Counters tab.
- Click on the Add Performance Counters button.
- Check the performance counters you'd like to add and click Save.
NoteSite24x7 allows only 200 rows per tabular performance counter.
What thresholds of tabular performance counters can I edit?
You can edit thresholds for:
- Individual tabular performance counters
- Individual performance counters in a table
- All tabular performance counters in bulk
To edit thresholds:
-
- Go to Network > Network Devices.
- Click on the device for which tabular performance counters need to be edited.
- From the device dashboard that opens, go to the Tabular Performance Counters tab.
To edit thresholds for individual tabular performance counters:
-
- Click on the pencil icon next to the tabular performance counter that needs to be edited.
- In the pop-up, toggle the button if you wish to ignore the alert.
- Enter the monitor value and the unit.
- Click Save.
- Click on the pencil icon
To edit thresholds for individual performance counters in the table:
-
- Click on the pencil icon next to the performance counter that requires edits to the threshold configuration.
- In the pop-up, toggle the button if you wish to ignore the alert.
- Enter the monitor value and the unit.
- Click Save.
- Click on the pencil icon
To edit thresholds for individual tabular performance counters in bulk:
-
- Click on the Threshold Configuration button near the Add Performance Counters button.
- In the pop-up, select the child monitors to edit the threshold configuration in bulk.
- Use the toggle button if you wish to ignore the alert.
- Enter the monitor value and the unit.
- Click Save.

Figure 13. Bulk Edit Threshold - Interface Collisions pop-up.NoteEditing the threshold configuration here will update the previously set threshold values.
How do I test tabular performance counters?
In the Tabular Performance Counters tab, click on the play icon![]() corresponding to the performance counter for which the threshold needs to be edited.
corresponding to the performance counter for which the threshold needs to be edited.
Viewing performance reports
In the Tabular Performance Counters tab, click on the ![]() icon next to a tabular performance counter table to view its performance report.
icon next to a tabular performance counter table to view its performance report.

Figure 14. Viewing attribute report.
How do I delete tabular performance counters?
In the Tabular Performance Counters tab, click on the delete icon ![]() corresponding to the tabular performance counter that you'd like to delete.
corresponding to the tabular performance counter that you'd like to delete.