Layer 2 Maps
Tracking a network's connections and monitoring each of its nodes and links requires mapping tools that are capable of discovering the various layers of that network. Site24x7's Layer 2 Maps help network professionals get a detailed view of the physical interconnections existing in their networks.
Layer 2 (or data link layer) maps discover port-to-port connections and linking properties.
The Layer 2 Maps view
- Log in to your Site24x7 account.
- Navigate to Network > Layer 2 Maps.
- Here, you can create and view Layer 2 network maps as well as Rediscover, Edit, and Delete maps.
Discovery mechanisms
Site24x7 discovers and maps Layer 2 networks based on the following protocols and discovery mechanisms:
- Address Resolution Protocol (ARP): ARP is used to map an IP address to a physical address or media access control (MAC) address that is recognized on the local device. ARP is mainly for Layer 3 switches and routers.
- Cisco Discovery Protocol (CDP): CDP is used to share information about Cisco devices that are directly connected. If your device is a Cisco device, we recommend using CDP for discovery.
- Forwarding Database (FDB): The FDB table is used by Layer 2 devices to store the MAC addresses that have been discovered and the ports on which those MAC address were discovered. In general, switches are discovered using the FDB.
- IP route: IP routes are routes taken from a routing table. Routing tables contain the necessary information for forwarding a packet along the best path toward its destination. Common routers and switches are discovered using an IP route.
- Link Layer Discovery Protocol (LLDP): LLDP is used to advertise the identity, capabilities, and neighbors on a wired LAN Ethernet.
Creating Layer 2 maps
- Navigate to Network > Topology/Layer 2 Maps > Layer 2 Maps.
- To create a new map, click the plus icon + beside Layer 2 Maps or click Create New in the top-right corner.
- In the Discover Layer 2 Map form that opens, enter the following:
- Discovery Type: Select Seed Device to start from a known device and discover its neighbors (Fig. 1), or select IP Range to scan a specified range of IP addresses (Fig. 2).
- Map Name: Enter a name to identify your map.
- Seed IP: Select Devices to discover and create a network map using a network device that is already being monitored, then select a device from the drop-down menu. If the device is not yet being monitored by Site24x7, select IP Address and, in the box that appears below, enter the IP address of the device you wish to discover and map.
NoteThe device will be added for monitoring if it is not being monitored already. This option will be available if you have selected Seed Device as the Discovery Type.
- IP Filters: Enter the start and end IPs of an IP range you want discovered. You should add a minimum of one IP range and can add more by clicking the plus icon +.
- Credentials: Choose the credentials to use from the drop-down menu. You can choose multiple credentials and add new credentials as well by clicking the plus icon + next to the drop-down menu.
- Discovery Mechanisms: Select appropriate discovery mechanisms from the drop-down menu. Selecting FDB or LLDP will automatically select ARP along with it. Always select an additional discovery mechanism while choosing ARP.
- On-Premise Poller: Select the On-Premise Poller from which the map has to be discovered, which should be an On-Premise Poller installed in the same network as the device.
- Discovery Type: Select Seed Device to start from a known device and discover its neighbors (Fig. 1), or select IP Range to scan a specified range of IP addresses (Fig. 2).
- Click Discover. Your map will be created with icons depicting the various devices in your network.
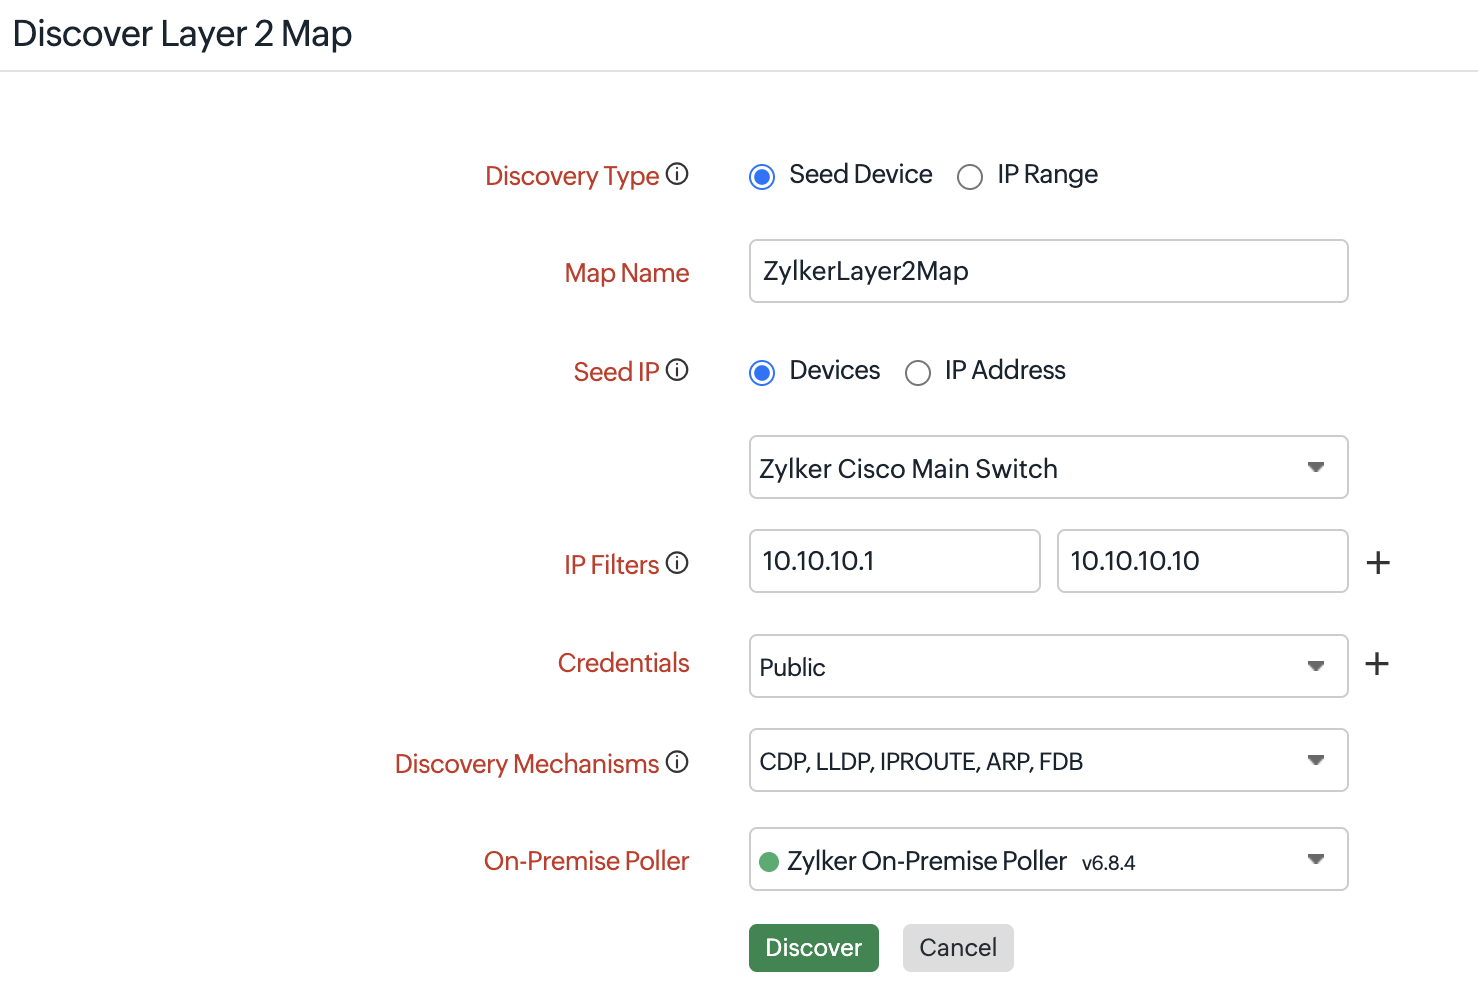
Figure 1. Discovering a Layer 2 map.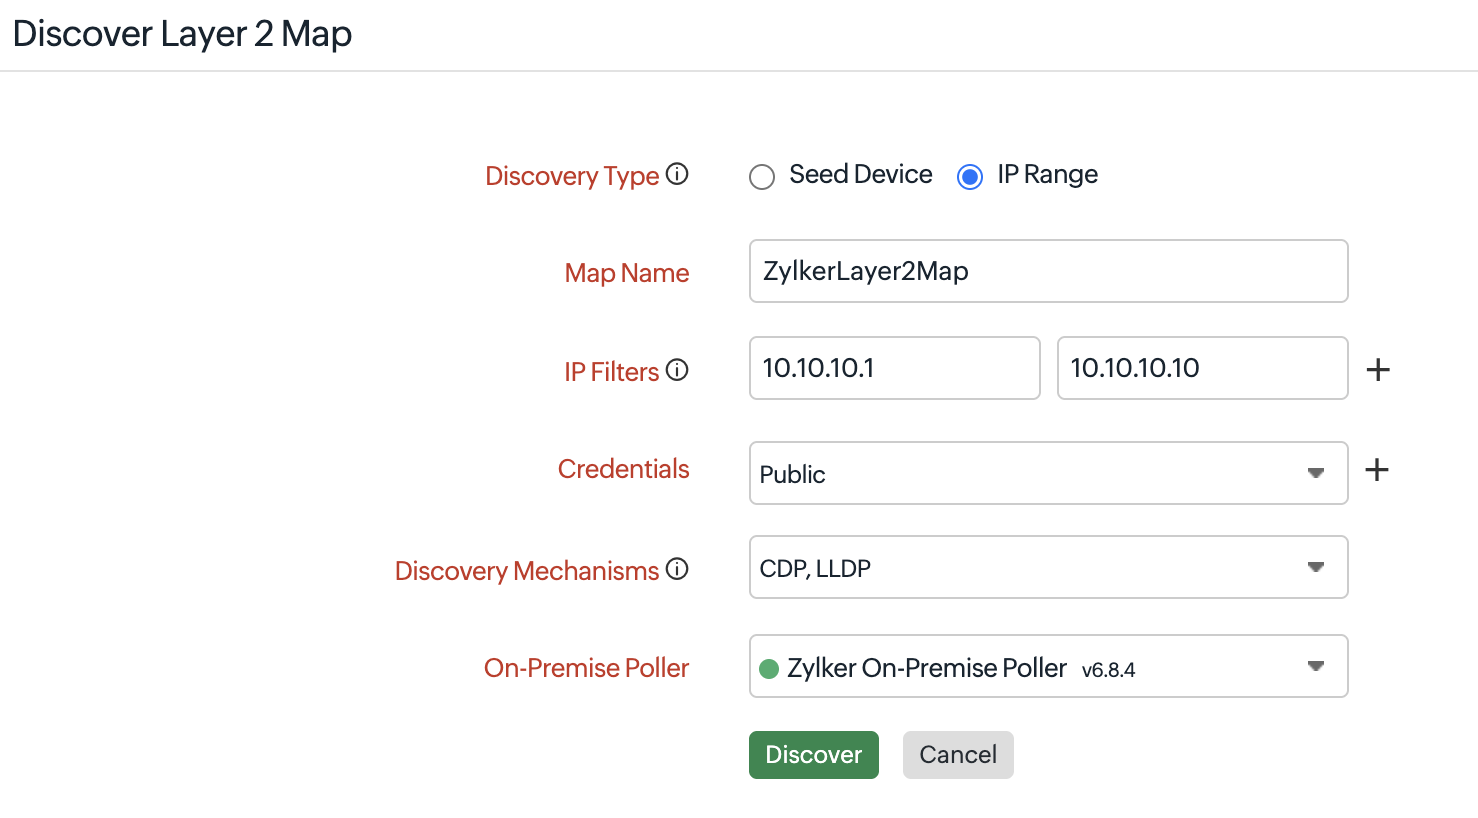
Figure 2. Discovering a Layer 2 Map from an IP range.
Edit Layer 2 maps
- Navigate to Network > Layer 2 Maps.
- Hover over the map which you would like to edit. You will see options to Rediscover, Edit, or Delete. Click Edit.
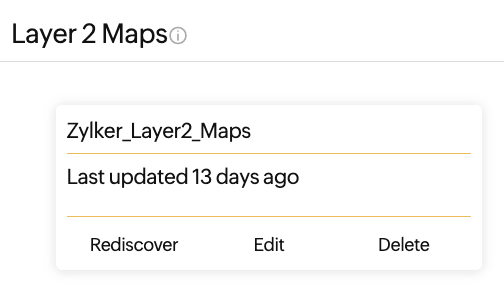
Figure 3. Editing a Layer 2 map. - Alternatively, you can click the map that needs to be edited and click Edit on the top-right corner.
Understanding the discovered Layer 2 maps
- Discovered and monitored devices are displayed as colored icons according to their status, as shown in the table below. Devices that are not yet monitored in Site24x7 are displayed as dark gray icons (Fig. 4).
Color Status 
Up 
Down 
Trouble 
Critical 
Configuration Error 
Discovery in Progress 
Maintenance 
Suspended
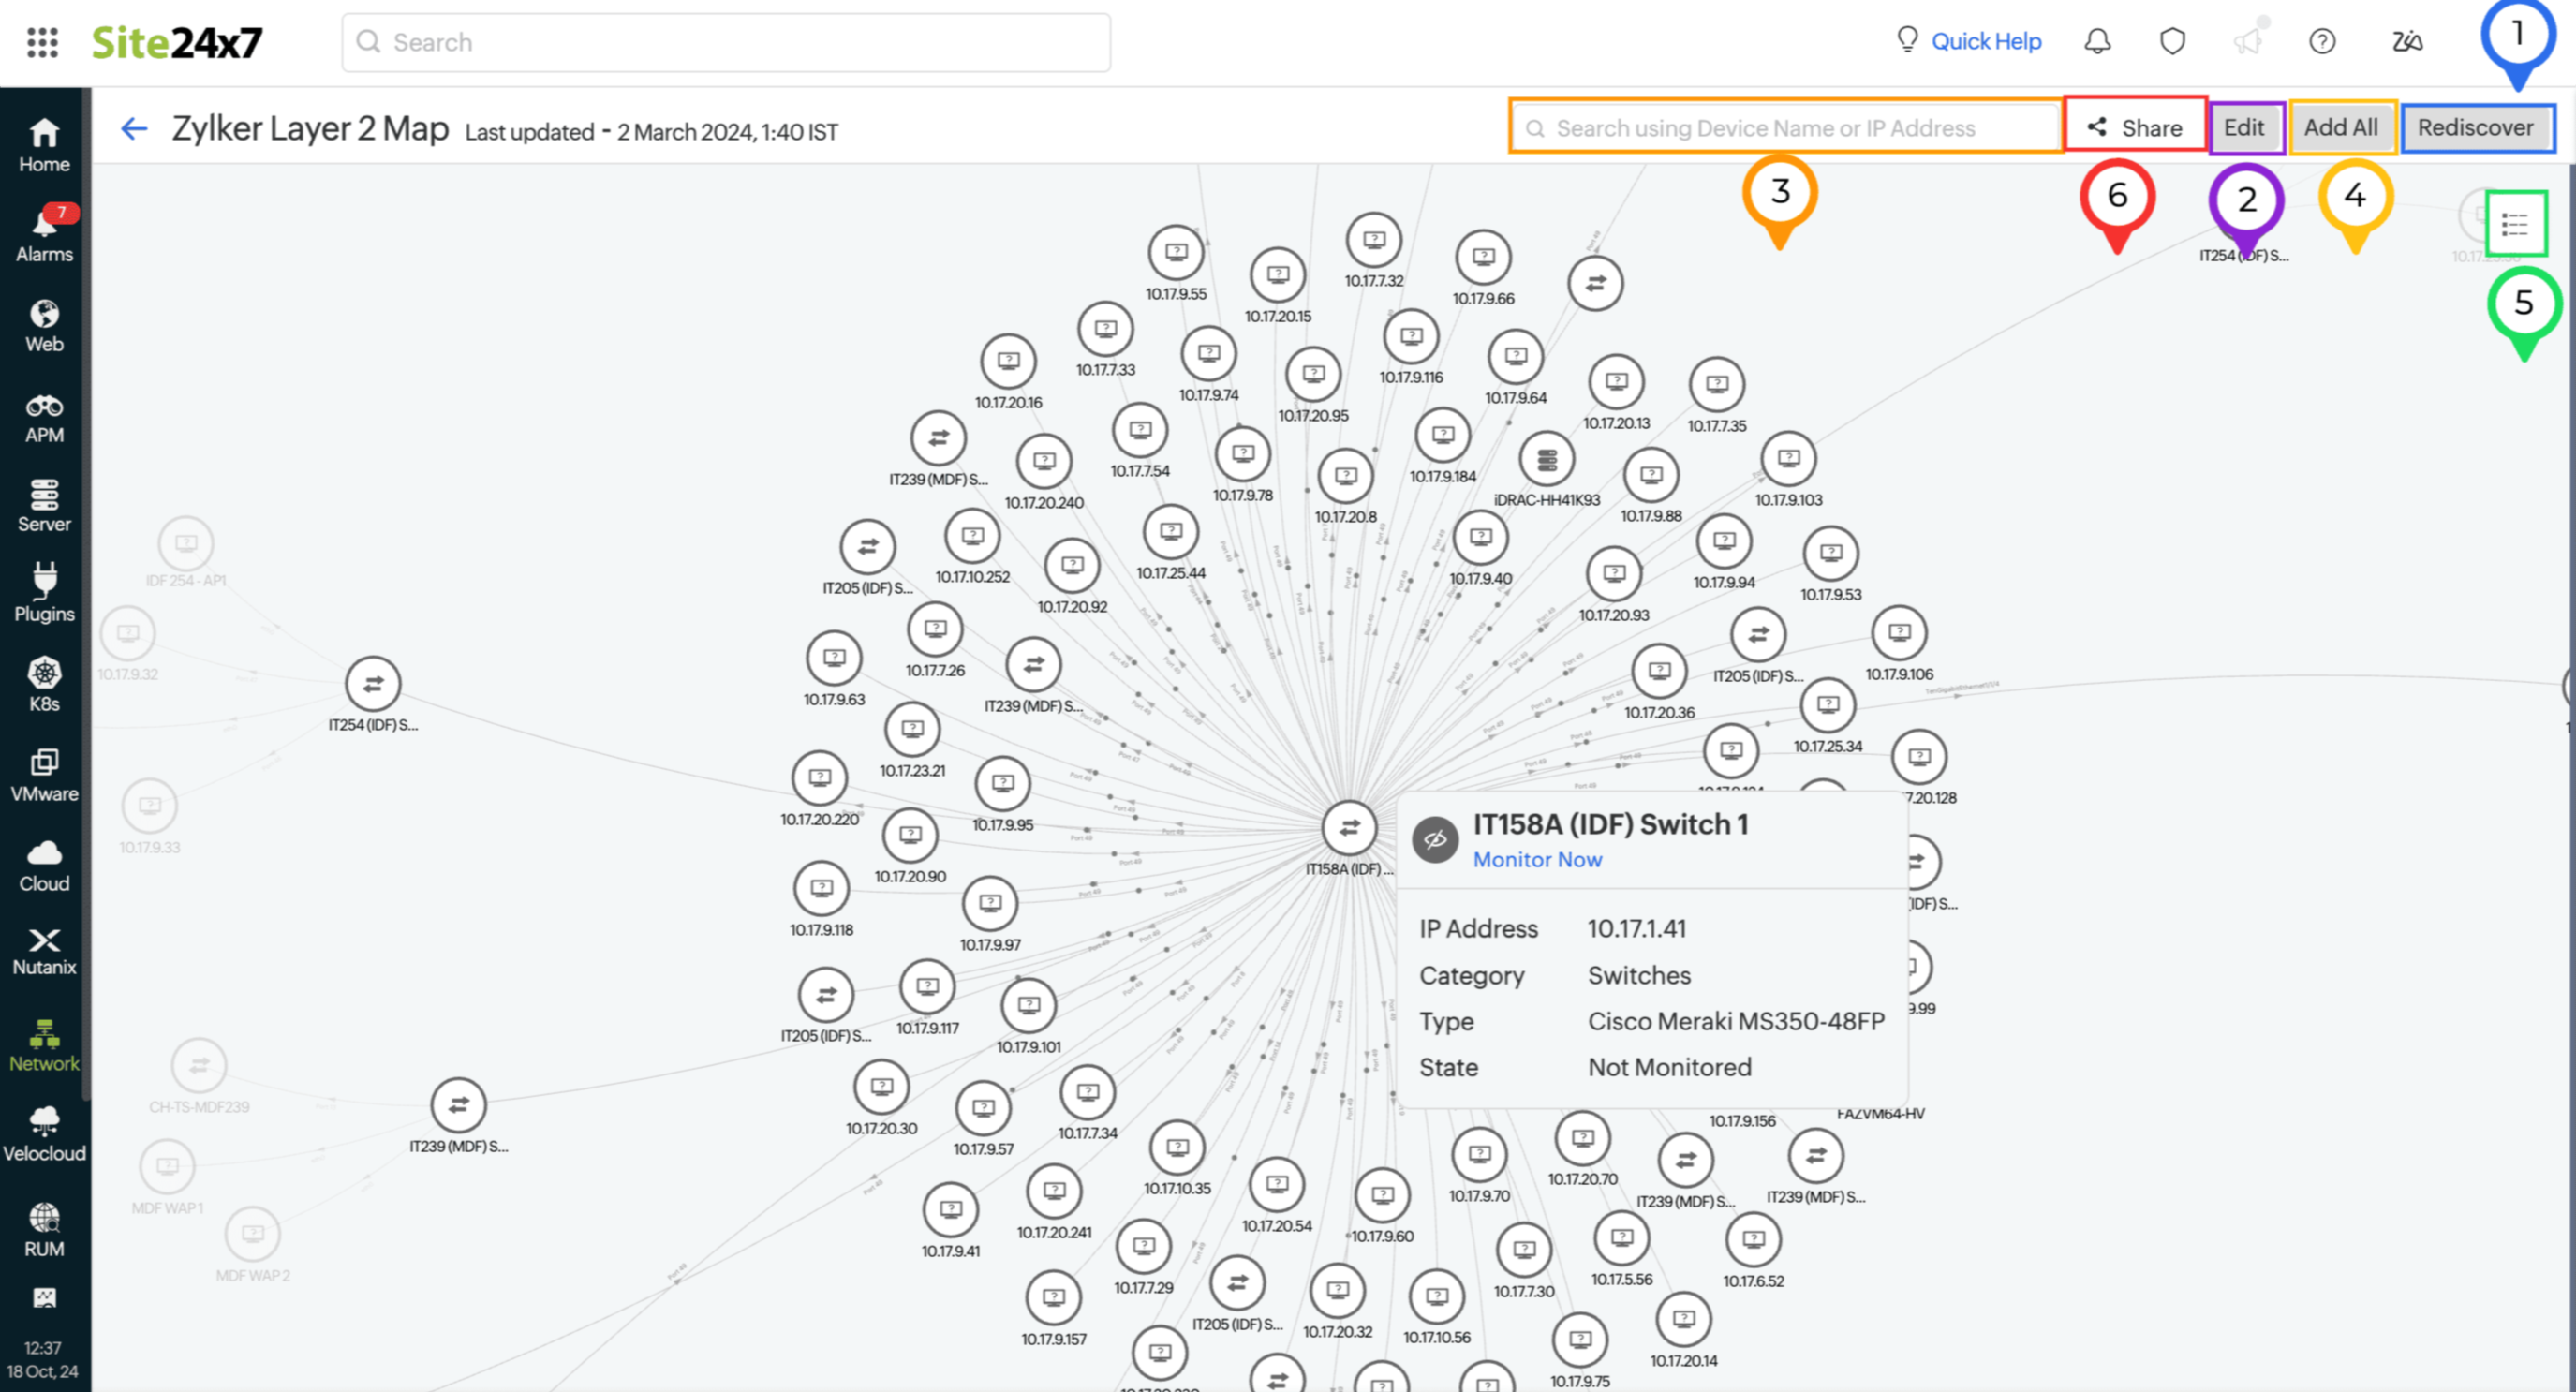
Figure 4. Viewing the Layer 2 map. - Hover over a node to view basic device details for the device. You can also view the direction of traffic flows as shown in Fig. 4.
- Clicking a node opens the Device Details tab on the right-pane.
- Right click on a node and click View Connections to view the devices directly connected to it as a separate view. Click Back in the Connections View to go back to the previous view.
- Right-click the node and select Monitor Summary to navigate to the monitor summary page.
- Right-click an unmonitored node, and click Add Monitor to open the Network Discovery page from where you can create a discovery profile for the device that you wish to discover. Click Start Discovery to discover the device and start monitoring it. Once the monitoring starts, the device icon on the Layer 2 map will display the appropriate status color.
- View the statuses of nodes and links as green, red, or yellow, which denote that they're Up, Down, or in Trouble, respectively.
- Links between network devices turn red or yellow when the connected interface is Down or in Trouble.
- Click Rediscover to discover the network again. It will display newly added devices and remove devices no longer in the network from the map (Fig 4, marked as 1).
- You can also edit a map and change IP ranges, credentials, and discovery mechanisms (Fig 4, marked as 2).
- You can Search by Device Name or IP Address in the search bar on the top-right corner (Fig. 4, marked as 3). After providing the details, press Enter to go to the next matching node or Shift + Enter to go to the previous node. You can also use the down and up arrows beside the search bar to look through the searched nodes.
- Click Open Map Inventory (Fig. 4, marked as 5) to view all the devices on the Layer 2 map. You can search using Device Name, IP Address, or Device Type in the search bar. By hovering over a monitored device in the Map Inventory, you can view the info icon
 beside the device. Click this to open the Device Details tab on the right pane. If you hover over an unmonitored device in the Map Inventory, there will be a plus icon + beside the device. Click this to open the Network Discovery form where you can add the unmonitored devices to the Layer 2 map. Select the On-Premise Poller and click Start Discovery to proceed.
 - Hover over a device to check the Ping response of a device and view its Traceroute from the map.
Bulk add devices
- Navigate to Network > Layer 2 Maps.
- Click the required map. To add the unmonitored devices to Site24x7, click Add All on the top-right corner (Fig. 4, marked as 4).
- On-Premise Poller: Select an On-Premise Poller and click Next.
- Device List: A Device List of all the unmonitored devices will appear. Select the devices that you wish to monitor and click Next.
- Discovery Details: Provide the discovery details and click Save to run the profile later or Save and Start Discovery to start discovering the devices for monitoring. Once monitoring starts for the device, the status changes will reflect on the map.
NoteOnce a subnet is added for Layer 2 map discovery, it will also be shown in Discovered Subnets in IPAM.
Sharing Layer 2 maps
Share the map by clicking the Share button (Fig. 4, marked as 6). Click Export as CSV to save the file to your device in CSV format, or click Share Link to copy the shareable link. If you click Share Link, in the pop-up that opens (Fig. 5):
- Toggle the switch beside Manage access (Fig. 5, marked as 1) to share the map with anyone on the internet.
- Click the IP icon (Fig. 5, marked as 2) to provide an IP range to share the map. If no IP range is provided, anyone with the link can view the map.
- Copy the link by clicking the copy icon
 under Manage access.
 - Check the public page by clicking the open icon
 .
. - Embed the code in your application or webpage by clicking the copy icon in the Embed code section.
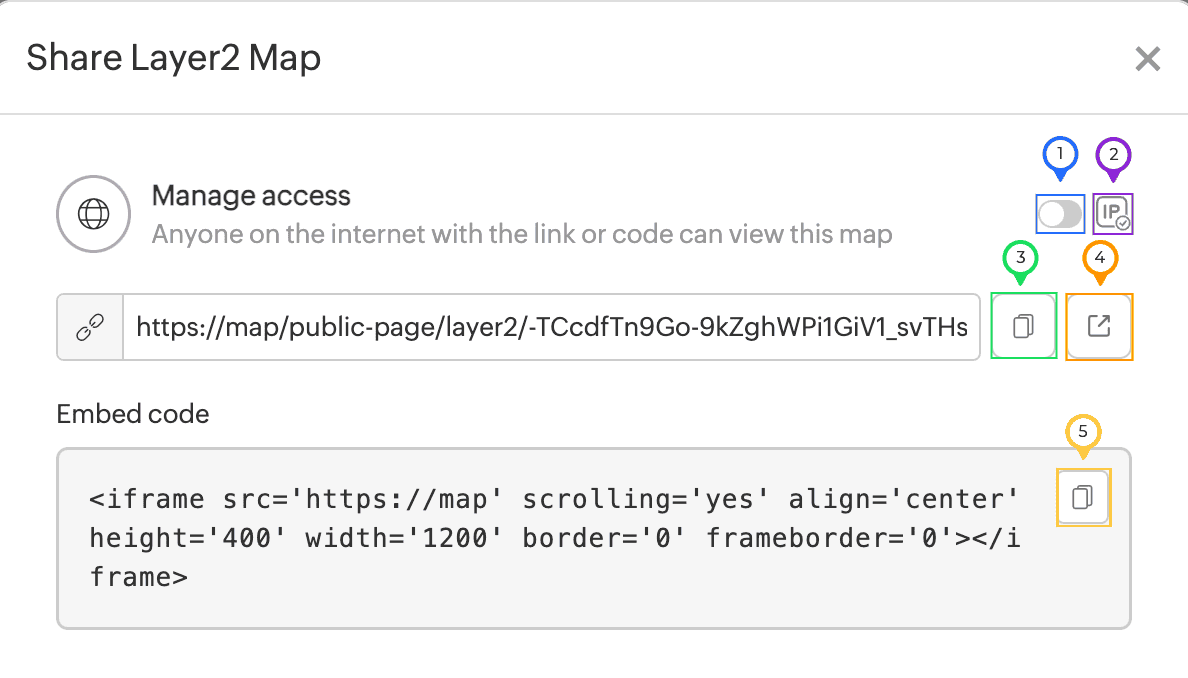
Figure 5. The Share Layer 2 Map pop-up.