Cisco Meraki Monitoring
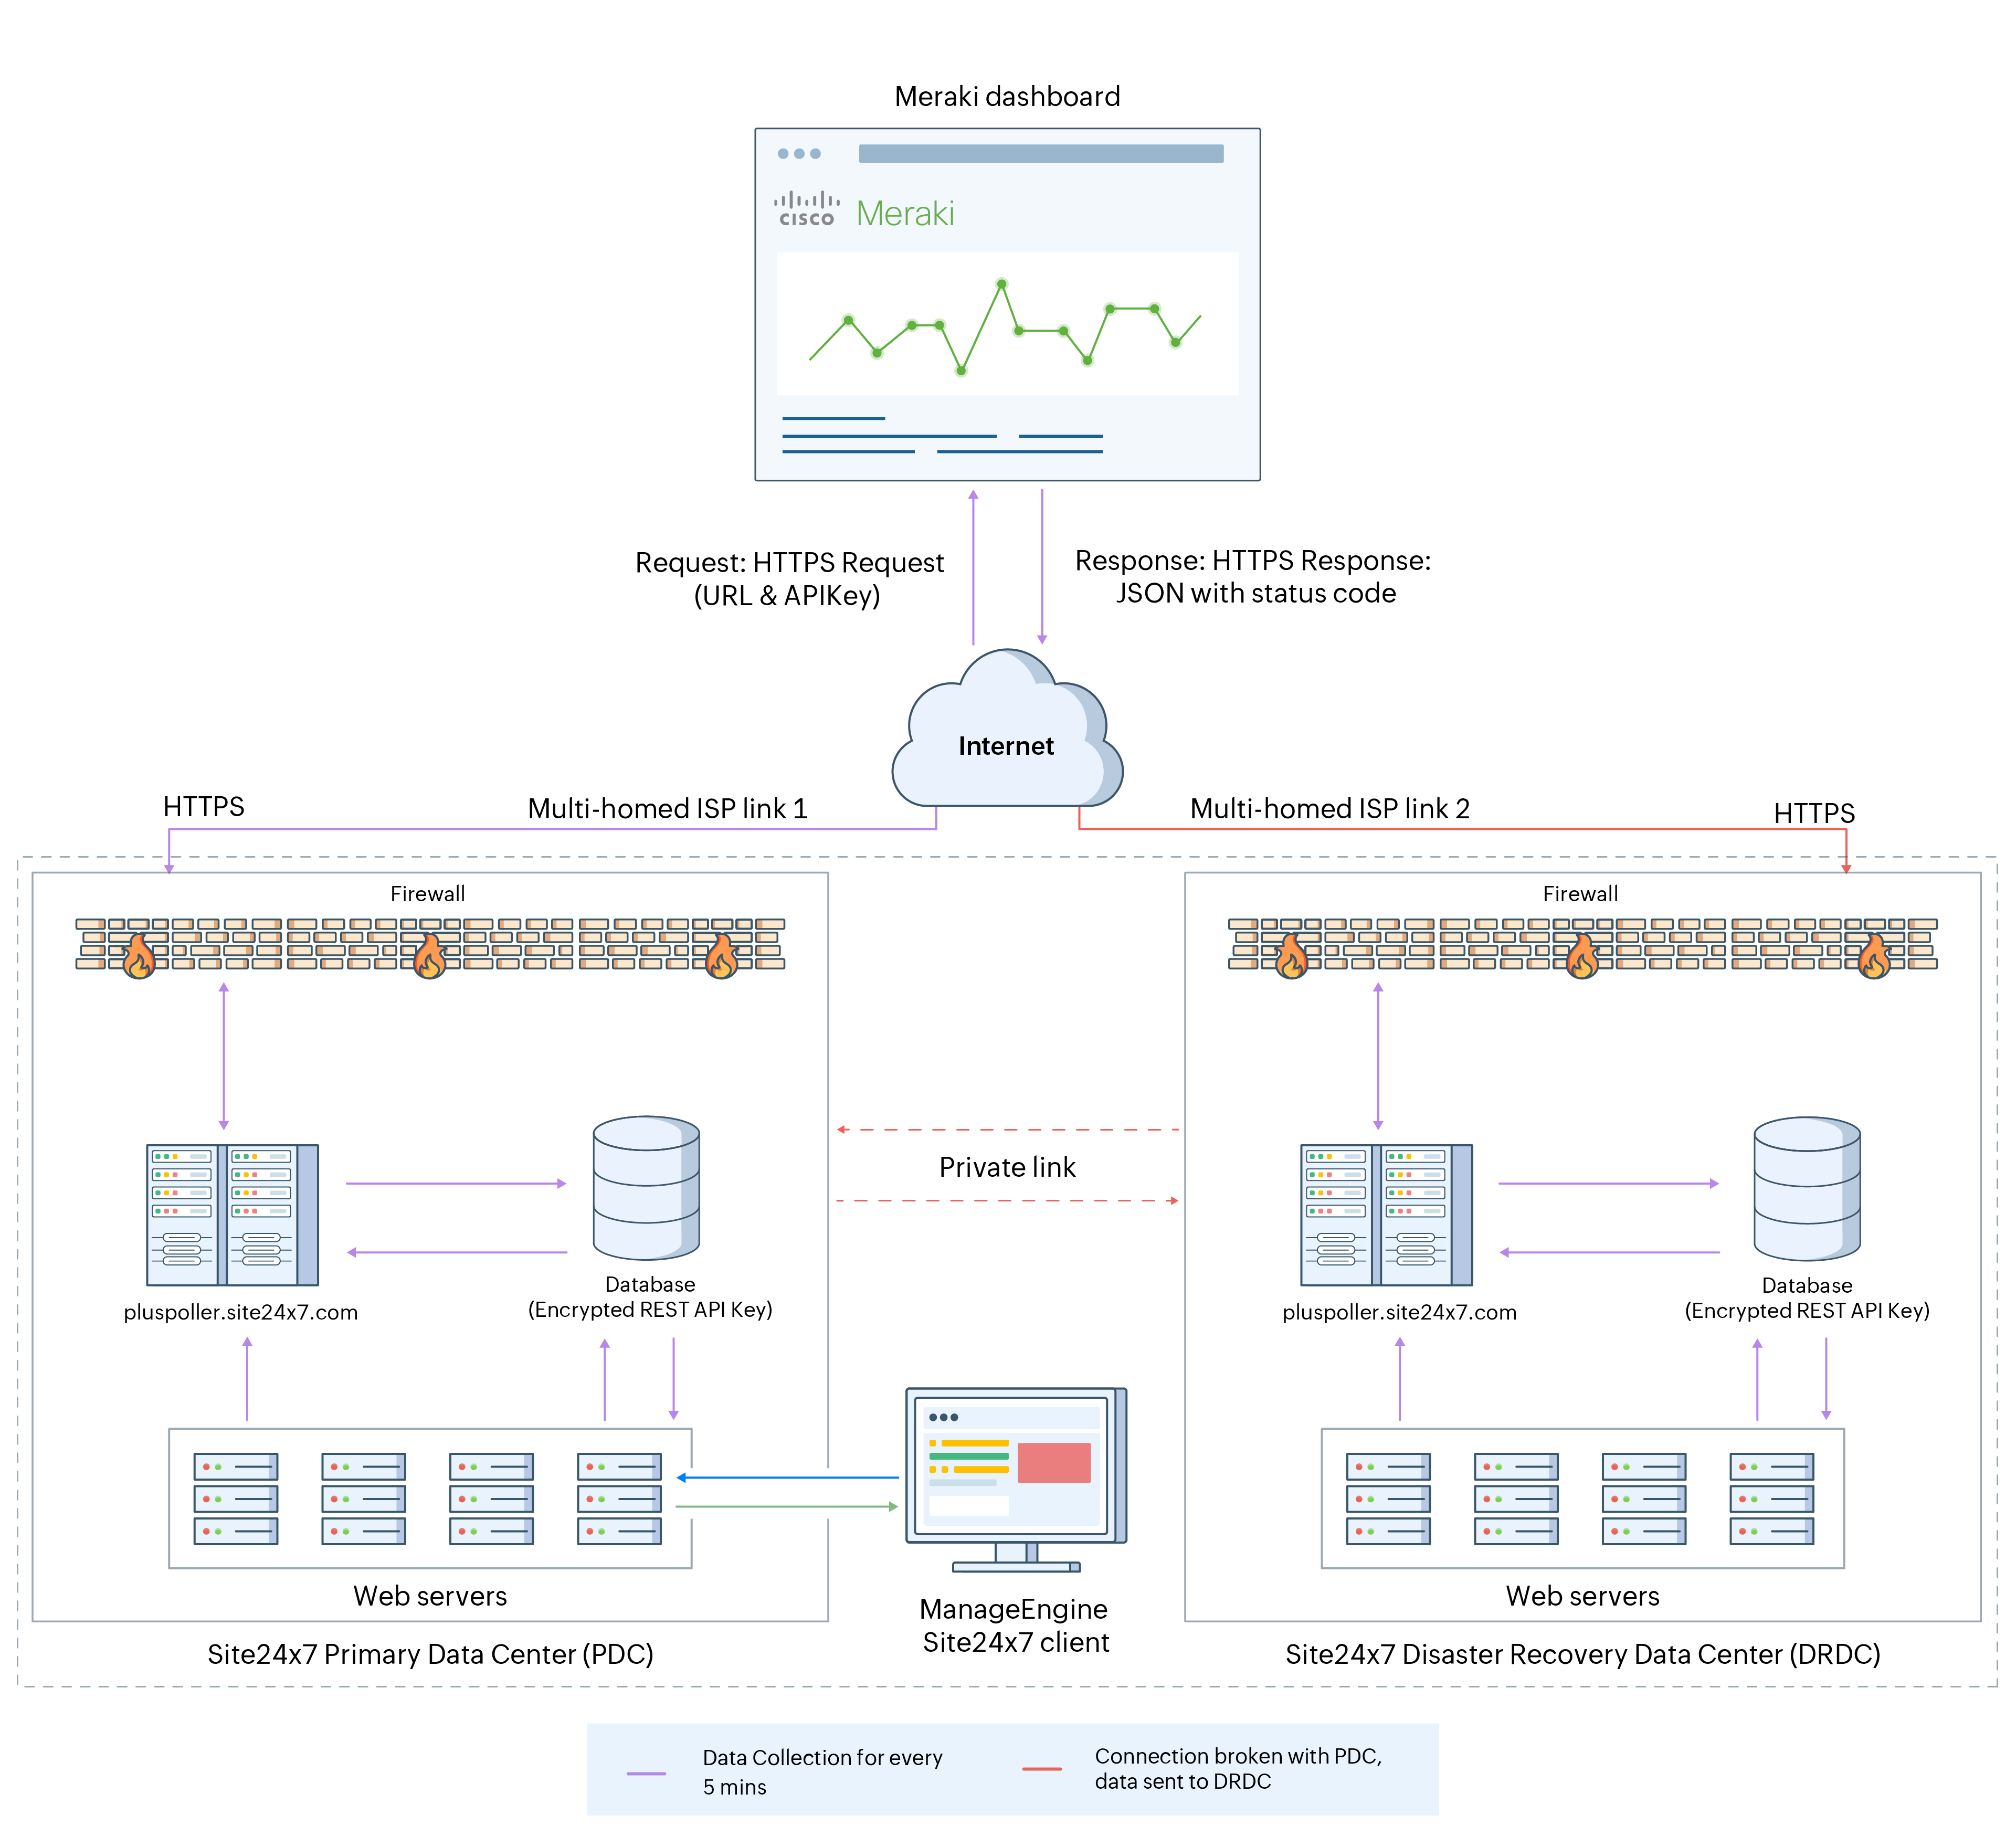
Site24x7's Cisco Meraki Monitoring tracks the availability of Cisco Meraki network devices, like switches, cameras, security, and various wireless devices, using REST APIs. Viewing the response time and packet loss for security devices helps identify connectivity issues and downtime.
When devices are Down, obtain instant alerts via email; SMS; voice call; or third-party integrations like Jira, Zapier, Slack, Microsoft Teams, and ServiceNow. Assign tickets to the right technician for quicker troubleshooting.
Prerequisites
The Meraki REST API Key generated in your Cisco Meraki dashboard needs to be granted read-only access to Site24x7.

How it works
Once you provide read-only access to Site24x7 for the Meraki REST API key generated in the Cisco Meraki dashboard, Site24x7 will begin discovering devices. When you choose and add devices and organizations for monitoring, Site24x7 will start monitoring Meraki device details like availability, outage history, log information, and configuration details across thousands of networks in your organization in minutes.
Add the Meraki organization and devices to be monitored
- Log in to your Site24x7 account.
- Navigate to Admin > Add Monitor, and click Meraki Monitoring under Network. Alternatively, you can go to SDN > Meraki, and click the plus icon beside Meraki Organizations or Meraki Devices.
- Enter details for the following fields:
- Display Name: Provide a name to identify the Meraki Organization monitor.
- Meraki REST API Key: The Cisco Meraki API key used to authenticate and securely connect Site24x7 to your Meraki dashboard via the Meraki cloud APIs.
- Meraki API URL: The Base URL for the Meraki API endpoints. For example: https://api.meraki.com
- Sync Meraki Device Names from Meraki Dashboard: When enabled, Site24x7 will automatically sync and display device names exactly as they appear in your Meraki dashboard.
NoteThe values will be updated once a day or if Poll Now is triggered for the monitor.
Then, click Next.
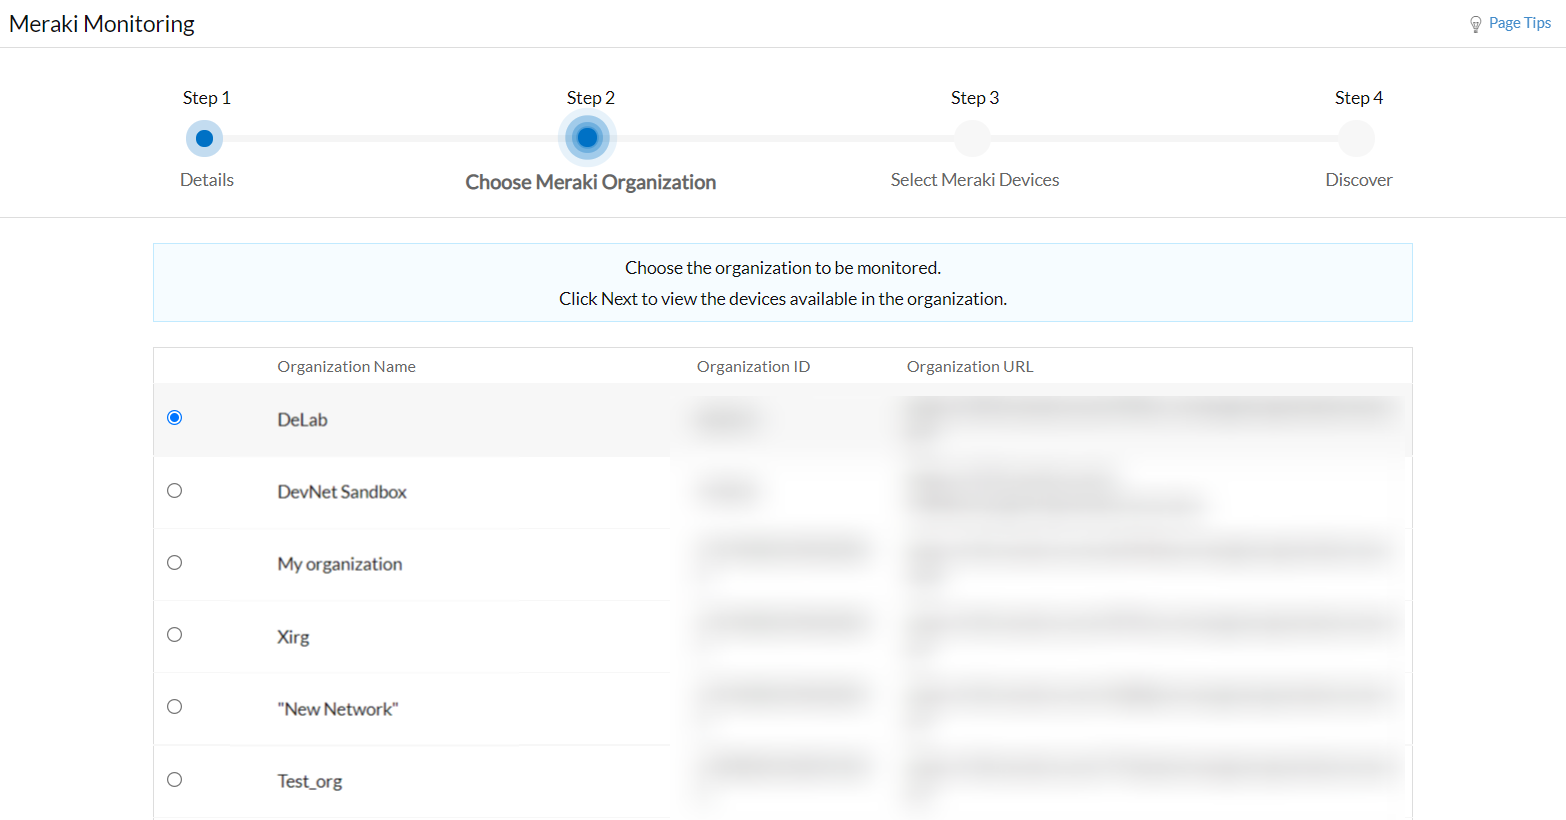
- Choose the Meraki organization to be monitored from the table with information like Organization Name, Organization ID, Organization URL, and click Next
- Select the Meraki devices to be monitored from the chosen organization, and click Next.
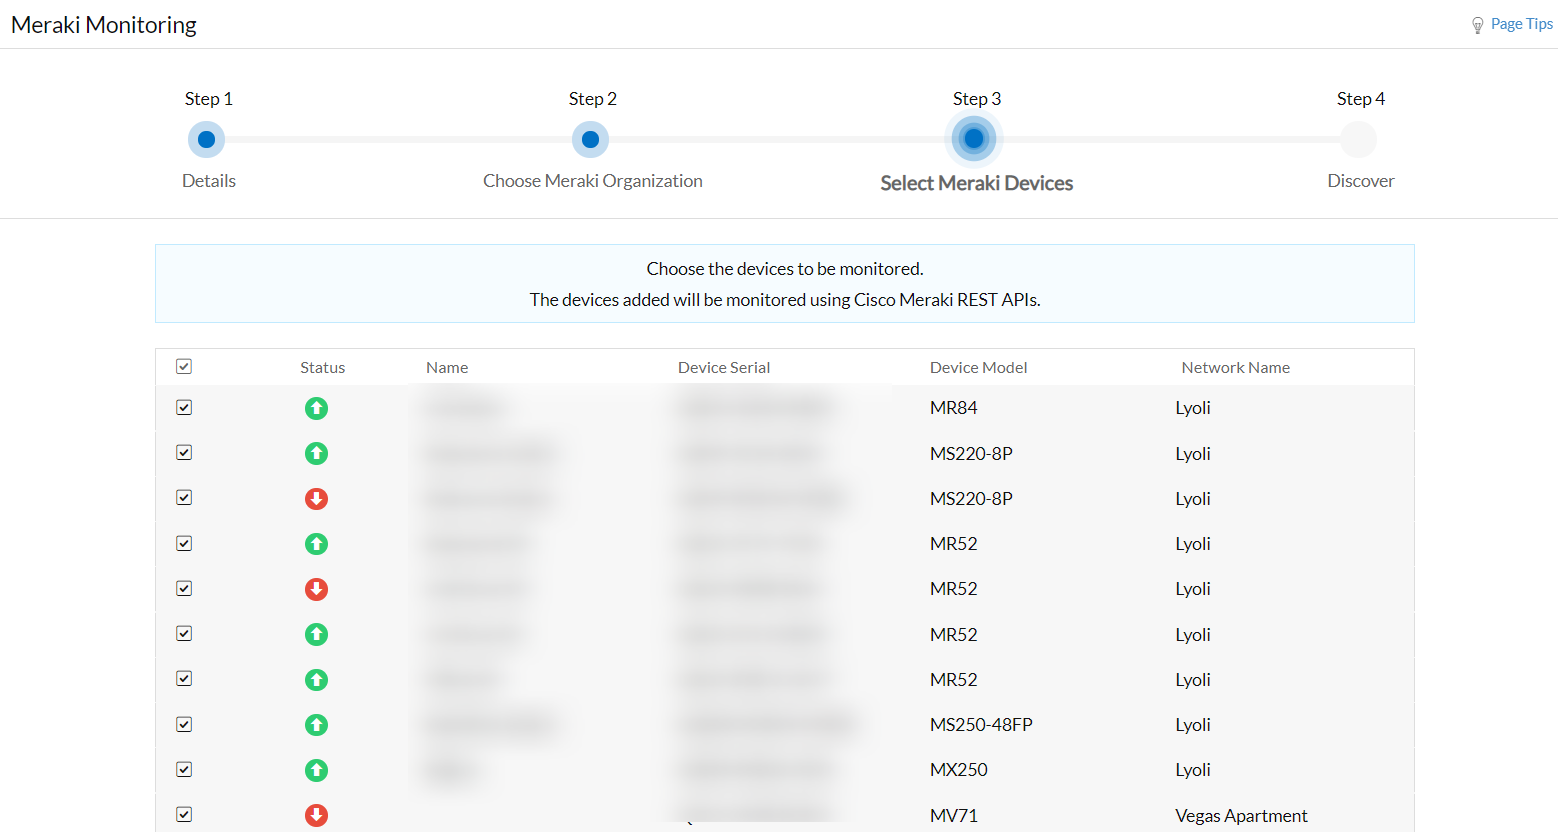
- Suppose you have already added a Meraki Organization as a monitor. In that case, you can click the Rediscover Meraki Devices button to initiate a fresh scan to detect and list all Meraki devices currently available in the organization.
Note- When a Meraki organization is discovered, all newly detected devices are automatically grouped into a monitor group named using the format [Organization Name]-[Network Name], making it easier to organize and manage devices by their network context.
- Once a day, the following information will be automatically updated—provided the Sync Meraki Device Names from Meraki Dashboard parameter is set to Yes for the organization:
- Meraki device names
- Tags
Performance Metrics and Reports
Track the response time and packet loss of security devices like firewalls. The performance metrics available are:
| Metric | Description |
|---|---|
| Response Time (ms) | View response time of the API calls between the Meraki security device and the Destination IP configured in the Cisco Meraki dashboard. |
| Packet Loss | View packet loss details for a Meraki security device. These metrics help you pinpoint connection errors instantly, enabling you to resolve issues quickly. |
View the performance metrics and monitor details of each Meraki organization or device by following these steps:
- Log in to your Site24x7 account.
- Click SDN > Meraki
- Click Meraki Organizations or Meraki Devices from the Monitor page to view the performance metrics and understand the device performance.
Threshold and Availability Profile
Set threshold values for different performance metrics monitored to be instantly alerted on any threshold breach and take necessary actions.
Cisco Meraki Map View
View all your monitored Cisco devices using the REST API on the Meraki Map View. Once you add your Cisco Meraki organizations and devices for monitoring, you can view them on Zoho Maps. This instantly helps you visualize the geographical location of the device and identify ones that need your attention. You can hover over the device to view more details about it.
Troubleshooting Tips
- How do I generate the Meraki REST API key?
- Unable to suspend or delete my Cisco Meraki organization monitor.
- Why is the monitor status shown as Down in the Cisco Meraki dashboard while shown as Up in Site24x7?
- What happens if the Cisco Meraki organization's REST API key exceeds the limit?
- Why aren't my Cisco Meraki devices being discovered?
- What are the Cisco Meraki APIs used for monitoring in Site24x7?