AppLogs Query Language
Collect, consolidate, index, and search logs to gain actionable insights using Site24x7 AppLogs. Add a log profile and log type to start managing your logs now. Run easy to understand language search to filter out invalid values and obtain actionable results quickly. Get to know more about query syntax, structure, and types from this doc.
Overview
- Syntax
- Query template
- Limitations to query constraints
- Query language
- Combining queries
- Recent searches
Here is a how-to video to search your logs using the query language in AppLogs:
Syntax
Supported operators
| Operator | Description |
| logtype | Search for logs of a particular framework type |
| monitor_name | Search for logs from a particular monitor |
| monitor_group | Search for logs from a particular monitor group |
| tags | Search for logs from monitors that share a common tag |
| and | Add a query constraint that includes the previous query |
| or | Add a query constraint that excludes the previous query |
| ratio | Find the ratio between the log message count that matches two different search criteria |
| groupby | Returns only the distinct values and counts the repetitions in the specified field |
| timeslice | Display the time for a log based on a specified interval |
| is empty | Designates that the associated field has a null value |
| is not empty | Designates that the associated field does not have a null value |
| sum | Returns the sum of the selected values in the field |
| min | Returns the minimum value in the field |
| max | Returns the maximum value in the field |
| avg | Returns the average of the values in the field |
| sd | Returns the standard deviation value |
| count_distinct | Returns the count of the distinct values |
| count | Returns the number of log messages that match the query |
| include | Shows only the selected fields from the search output |
| exclude | Excludes and shows values other than the given fields from the search output |
| before | Returns the result of the query in the same time an hour, a day, or a week before |
| timeslice with before | Compares the query at the same time an hour, a day, or a week before, sliced by time |
| count with before | Compares the count of the results at the same time an hour, a day, or a week before |
| having | Apply conditions over the groupby query and get the required output |
| sort | Returns the sorted values based on some fields |
| STARTSWITH | Gives the values that start with the given search criteria |
| LIKE | Allows to use search criteria with asterisk in values |
| in | Similar to using multiple 'or' with '=' |
| notin | Similar to using multiple 'and' with '!=' |
| histo | Gives a histogram for a numerical field |
| range | Returns a custom range for a histogram |
| range interval | Returns a constant interval output for a histogram |
| top | Obtain the most recent value for the grouped elements. |
| limit | Specify the maximum number of results for the group by queries |
| percentage | Displays the ratio in terms of 100. |
| percentile and percents | The value below which a given percentage of data is present. |
| not | Add a query constraint that excludes specific results from the query |
Numeric operators
If a field is a number field, you can include operators (>, <,=, !=, <=, or >=) to match it with its value.
| Operator | Description |
| > | Is greater than. |
| << /td> | Is less than. |
| = | Is equal to. |
| >= | Is greater than and equal to. |
| <=< /td> | Is less than and equal to. |
- Operations like CONTAINS, NOTCONTAINS, and STARTSWITH are not supported for the fields monitor_name, monitor_group, log_source and tags as these fields do not support such filtering criteria.
- The units of a field value can also be given as converted units in the query condition instead of raw units.
For example, unit of timetaken field is milliseconds. So, instead of writing this query as,
logtype="Apache Access Logs" and timetaken>1000
It can also be written as,
logtype="Apache Access Logs" and timetaken>1s
String operators
If a field is a string field or any non-numeric field, it can have have the following operators: =, !=, and CONTAINS.
| Operator | Description |
| = | Is equal to. |
| != | Is not equal to. Does not contain. |
| CONTAINS | Returns values that contain the preferred value. |
| DOES NOT CONTAIN | Returns values that do not contain the preferred value. |
The "CONTAINS" query in the query language operates differently from a standard string "CONTAINS" query. It checks for matching tokens in the log, so a single word without spaces, special characters or changes in letter casing is indexed as a single token and will not be fetched by the "CONTAINS" query.
For instance, consider the sample strings and their corresponding tokens below:
| Sample strings | Token |
| User | U, ser |
| UserName | User -> U, ser, Name->N,ame |
| Status200 | Status->S, tatus, 200 |
In the screenshot below (Fig 1), the first log line was excluded by the "CONTAINS" query (Fig 2) because the term "error" did not match the single token "errortest," which was treated as a single token by the "CONTAINS" query.

Fig 1

Fig 2
In such cases, you can use the "LIKE" query as shown in the screenshot below:

Query template
The general format for how a query should look like is as follows:
logtype = "examplelogtype" and "exampleNumericField1" [>,<,=,<=,>=] "dummynumber" or "examplestringfield1" [CONTAINS,!=,=] "examplesubstring1" groupby "examplestringfield2" timeslice [h,d,m]
Limitations to query constraints
- The timeslice and count constraints cannot have any other constraint come after them.
- A groupby constraint can only be followed by a timeslice constraint.
- Count and count distinct constraints cannot co-exist.
- A Count constraint can be used only at the end of a query and the query should not contain groupby, timeslice, and aggregation constraints in it.
- The keywords groupby and LIKE evaluate only the first 100 characters of a field value. Content beyond this limit is ignored during query execution, which may affect grouping accuracy and pattern match results for long field values.
Query language
To search using query language, follow this format:
logtype="(name of log type)" and (other conditions)
In this format:
- (name of log type) should be the display name of any previously added log type.
- (other conditions) could be any conditions. You can use the following operators for each condition: and, or, or !.
Sample query:
logtype="SysLogs" and application CONTAINS "systemd"
In this example:
- (name of the log type) is SysLogs.
- (other conditions) is application CONTAINS "systemd".

Result: This query fetches the log entries with the log type "SysLogs" and the application field containing "systemd".
Combining queries
You can also group together multiple conditions like in the examples below.
-
Simple queries with monitor name
logtype="SysLogs" and monitor_name CONTAINS "Zylker-server" and application CONTAINS "kernel"
In this query, both the monitor name and the application field value will be used to search for logs. Values with the monitor name "Zylker-server" and applications containing "kernel" will be displayed as a result.
logtype="SysLogs" and (application CONTAINS "kernel" or application CONTAINS "systemd") and message CONTAINS "pcieport"
In this query, the conditions inside the bracket are grouped together. Any log entry with application field containing "kernel" or "systemd" will be displayed as a result.
-
Timeslice
Adding timeslice (time period) at the end of a query generates a table of the selected total time period for the query, divided by slices of time specified in query versus count of log entries. Possible timeslice values use the units d (day), h (hour), or m (minute).
logtype="SysLogs" timeslice 2h

-
Or
Returns a value that matches either of the conditions provided.
logtype="IIS Access Logs" and (method="GET" or method="POST" or method="PUT")
This query fetches all GET, POST, and PUT method requests.

-
is empty
Returns results when the associated field doesn't contain any value.
logtype="Windows Event Logs" and IsEmpty(user)
-
is not empty
Returns results when the associated field contains any value.
logtype="Windows Event Logs" and IsNotEmpty(source)
-
Ratio
Using this operator, you can find the ratio between two query outputs. You can use the or query to compare the two criteria and append them with the ratio to fetch the result in the search query. Use timeslice to filter out the ratio at a specific time interval.
logtype="Apache Access Logs" and (status=200 or status>200) ratio
logtype="Apache Access Logs" and (status=200 or status>200) timeslice 1h ratio

-
Groupby
Use the Groupby (field name) syntax to count and display the number of log entries with the same value for the provided field. For example, to view the number of syslog entries grouped by the application field, execute:
logtype="SysLogs" groupby application
In this query, the number of entries with the same value for the application field are displayed.
The Groupby keyword evaluates only the first 100 characters of a field value. If a value exceeds this limit, different values that share the same first 100 characters may be grouped together and treated as identical.

-
SUM(), MIN(), MAX(), AVG()
Using this, you can find the minimum, maximum, average, and sum of the number fields in your logs.
For example, you can use this for numerical values in your logs wherein you wish to obtain the aggregate data.
logtype="IIS Access Logs" AVG(timetaken) MIN(timetaken) MAX(timetaken) SUM(timetaken)
This query fetches the aggregate time taken values.

-
Standard Deviation
Using this, you can find sd values for a set of data. This helps you determine the amount of variablity in the given data set. You can use sd to find variations of metrics like responsesize and timetaken, from their average value.
For example, the following query,
logtype="Apache Access Logs" sd(responsesize)
Returns the sd value for response size across the logs.

-
Count distinct
Count distinct in a query fetches only the count of the distinct values.
For example, when you want to know the total number of the specified distinct value in your logs, count distinct can be used.
logtype="Windows Event Logs" COUNT_DISTINCT(source)
The result displays the count of the distinct values.
Count and Count distinct cannot co-exist.

-
Count
Using Count at the end of a query will give you the total number of log messages that match the constraints in the query.
logtype="Windows Event Logs" and source CONTAINS "Microsoft-Windows-Security-Auditing" count
The result fetches the number of log messages that match the above conditions.

-
Combining groupby and aggregation together
The search below generates a groupby table, with additional columns for aggregation values.
For example, when you want aggregate results for the values grouped in a groupby table, this combination can be helpful.
logtype="IIS Access Logs" AVG(timetaken) MIN(timetaken) MAX(timetaken) groupby stemuri
In this query, Min, Max, Avg, and Count of unique stemuri are displayed.

-
Combining timeslice and aggregation together
The search below generates a timeslice table, with additional columns for aggregation values.
For example, when you want aggregate results on a timely basis, you can use this combination.
logtype="IIS Access Logs" AVG(timetaken) MIN(timetaken) MAX(timetaken) timeslice 1h
In this query, Min, Max, Avg, and Count timesliced by one hour is displayed.

-
Combining groupby and timeslice together
The search below generates a timeslice table, with an additional column for groupby values. Going from left to right, the columns read: timeslice, count, and value(s).
For example, when you want your results timesliced, and at the same time grouped based on the given constraint, you can use both groupby and timeslice together in a query.
logtype="SysLogs" groupby application timeslice 1d
In this query, the number of log entries that are timesliced by a day and have the same values for the field "application" are displayed.

-
Multiple groupby
The search below generates a table with multiple groupby options.
For example, when you have multiple options for groupby, you can use groupby separated by commas so that you can consolidate and view multilevel groupbys in a single table.
logtype="ServerLogs" groupby sourcefilename,loglevel,threadname
In this query, multiple groupby conditions are grouped together.

-
Include
Using Include in a search query fetches results with the specified fields diaplayed.
logtype="SysLogs" | include(application,message)
In this query, the search output will be displayed along with application, message.

-
Exclude
Using Exclude in a search query fetches results with the specified fields omitted.
logtype="SysLogs" | exclude(pid)
In this query, the search output will be displayed without the message pid.

-
Before
Using this operator you can view the result of the query in the same time, an hour, a day or a week ago.
For example, when you want the result for the given query that was available before some time, use before.
logtype="Apache Access Logs" avg(responsesize) | before 7d
This query will fetch the avg(responsesize) that was at the same time a week ago.

-
Timeslice with before
Using this in the query, you can compare the result of the query in the same time, an hour, a day or a week ago, at frequent intervals.
For example, when you want to compare the trend of the status code for the same day last week at a specified frequency, you can use timeslice with before.
logtype="IIS Access Logs" and statuscode>400 timeslice 1h | before 7d
This query will fetch the statuscodes > 400 that was at the same time a week ago, at one hour intervals.

-
Count with before
Using this in the query, you can compare the count of the result of the query in the same time, an hour, a day or a week ago.
For example, when you want to compare the number of failure status codes for the same day last week, you can use count with before.
logtype="IIS Access Logs" and statuscode>200 count | before 7d
This query will fetch the failure statuscodes that was at the same time a week ago.

-
Having
Using this operator you can apply some condition over the groupby query and get the required output.
logtype="Apache Access Logs" groupby requesturi having avg(responsesize)>10240
This query fetches the output for requesturi which has avg(responsesize)>10240.

-
Sort
This sorts the requests based on some fields.
For example, when you want to organize or categorize your results based on some values, you can use sort.
Note: This can be used only with group queries.
logtype="Apache Access Logs" groupby requesturi sort avg(responsesize)
This query fetches the output for requesturi sorted by the avg(responsesize) value.

-
STARTSWITH
Gives the values that start with the given search criteria. This fetches results similar to using LIKE with a * at the end. i.e., searching STARTSWITH "Log" will be similar to searching LIKE "Log*"
logtype="Windows Event Logs" and source STARTSWITH "Micro"
This fetches results for all the sources that start with Micro.

-
LIKE
This is case sensitive and enables search criteria with asterisks in the values.
For example, LIKE "Log*n" will match both Logon and Login.
To fetch results for any source with Microsoft Security Auditing, Microsoft Windows Auditing, etc., execute:
logtype="Windows Event Logs" and source LIKE "Microsoft*Auditing"
Pattern matching with the LIKE keyword is applied against the first 100 characters of a field value. If the field value exceeds 100 characters, only the initial 100 characters are evaluated, and any pattern match beyond this range will not return results.

-
in
Similar to using multiple 'or' with '='. All values in a set will be compared.
For example, Status in("200","404","500") will be the same as (status="200" or status="404" or status="500").
logtype="Apache Access Logs" and referer in("Refer 2, "Refer 1")
This fetches results similar to (referer="Refer 2" or referer="Refer 1")

-
notin
Similar to using multiple 'and' with '!='. All values in a set will be compared.
For example, status notin("200","404","500") will be the same as (status!="200" and status!="404" and status!="500").
logtype="Apache Access Logs" and referer notin("Refer 2, "Refer 1")
This fetches results similar to (referer!="Refer 2" or referer!="Refer 1")

-
histo
Gives histogram for a numerical field. This is similar to groupby, but instead of a common value, a range of values is returned.
logtype="Apache Access Logs" histo responsesize
This fetches a histogram based on the response size.

Note:
You can also use histogram along with groupby to further partition and analyze the log data.
For example,
logtype="Apache Access Logs" histo responsesize groupby requesturi

logtype="Apache Access Logs" groupby requesturi histo responsesize

-
range
This is used to fetch a custom range from a histogram. Range should be used only after histo.
For example, status notin("200","404","500") will be the same as (status!="200" and status!="404" and status!="500").
logtype="Apache Access Logs" histo responsesize range(3800 to 4000,4200 to 4400)
This fetches a histogram for the custom range values mentioned.

-
range interval
This is used to fetch results with custom time intreval from a histogram. Range interval should be used only after histo.
For example, when a range interval is specified after a histogram field, it fetches the histogram for the custom time interval.
logtype="Apache Access Logs" histo timetaken 1s
This fetches a histogram for the custom time interval of 1s.

-
top
Use top with groupby query to extract the most recent value from the grouped elements. Using the top query, you may retrieve important metrics from logs.
logtype="IIS Access Logs" top(ServerIP,stemuri,clientip) groupby Methodname
You can get the most current values on various topic statuses in the above query, such as topic offset and lag count.

Use with the groupby queries to display more than the default ten results from grouped elements. Adjust the limit to get the desired number of results. By default, the groupby query will return the top 10 results. To get more results, you need to use limit N. The maximum allowed value for N is 1000.
logtype="Infrastructure Events" groupby SourceName limit 30
With the above query, you can retrieve up to 30 log entries categorized by their source name.

-
percentage
Using percentage, derive general statistical information from logs. You may find the percentage of failed requests with the query below.
logtype="IIS Access Logs" and statuscode>=400 percentage

-
percentile and percents
Use percentile and percent to interpret performance data more accurately.
logtype="IIS Access Logs" percentile(TimeTaken percents(95))
You may find the 95th percentile of a request's processing time with the query above.

-
Combining percentile, timeslice, and aggregation together
The search below generates a trend chart displaying both average and percentile values as trend lines. An aggregation percentile timeslice query provides percentile values aggregated over specific time intervals.
For example, when you want to compare average and percentile results on a timely basis, you can use this combination.
logtype="IIS Access Logs" avg(TimeTaken) percentile(TimeTaken) percents(99) timeslice 15m

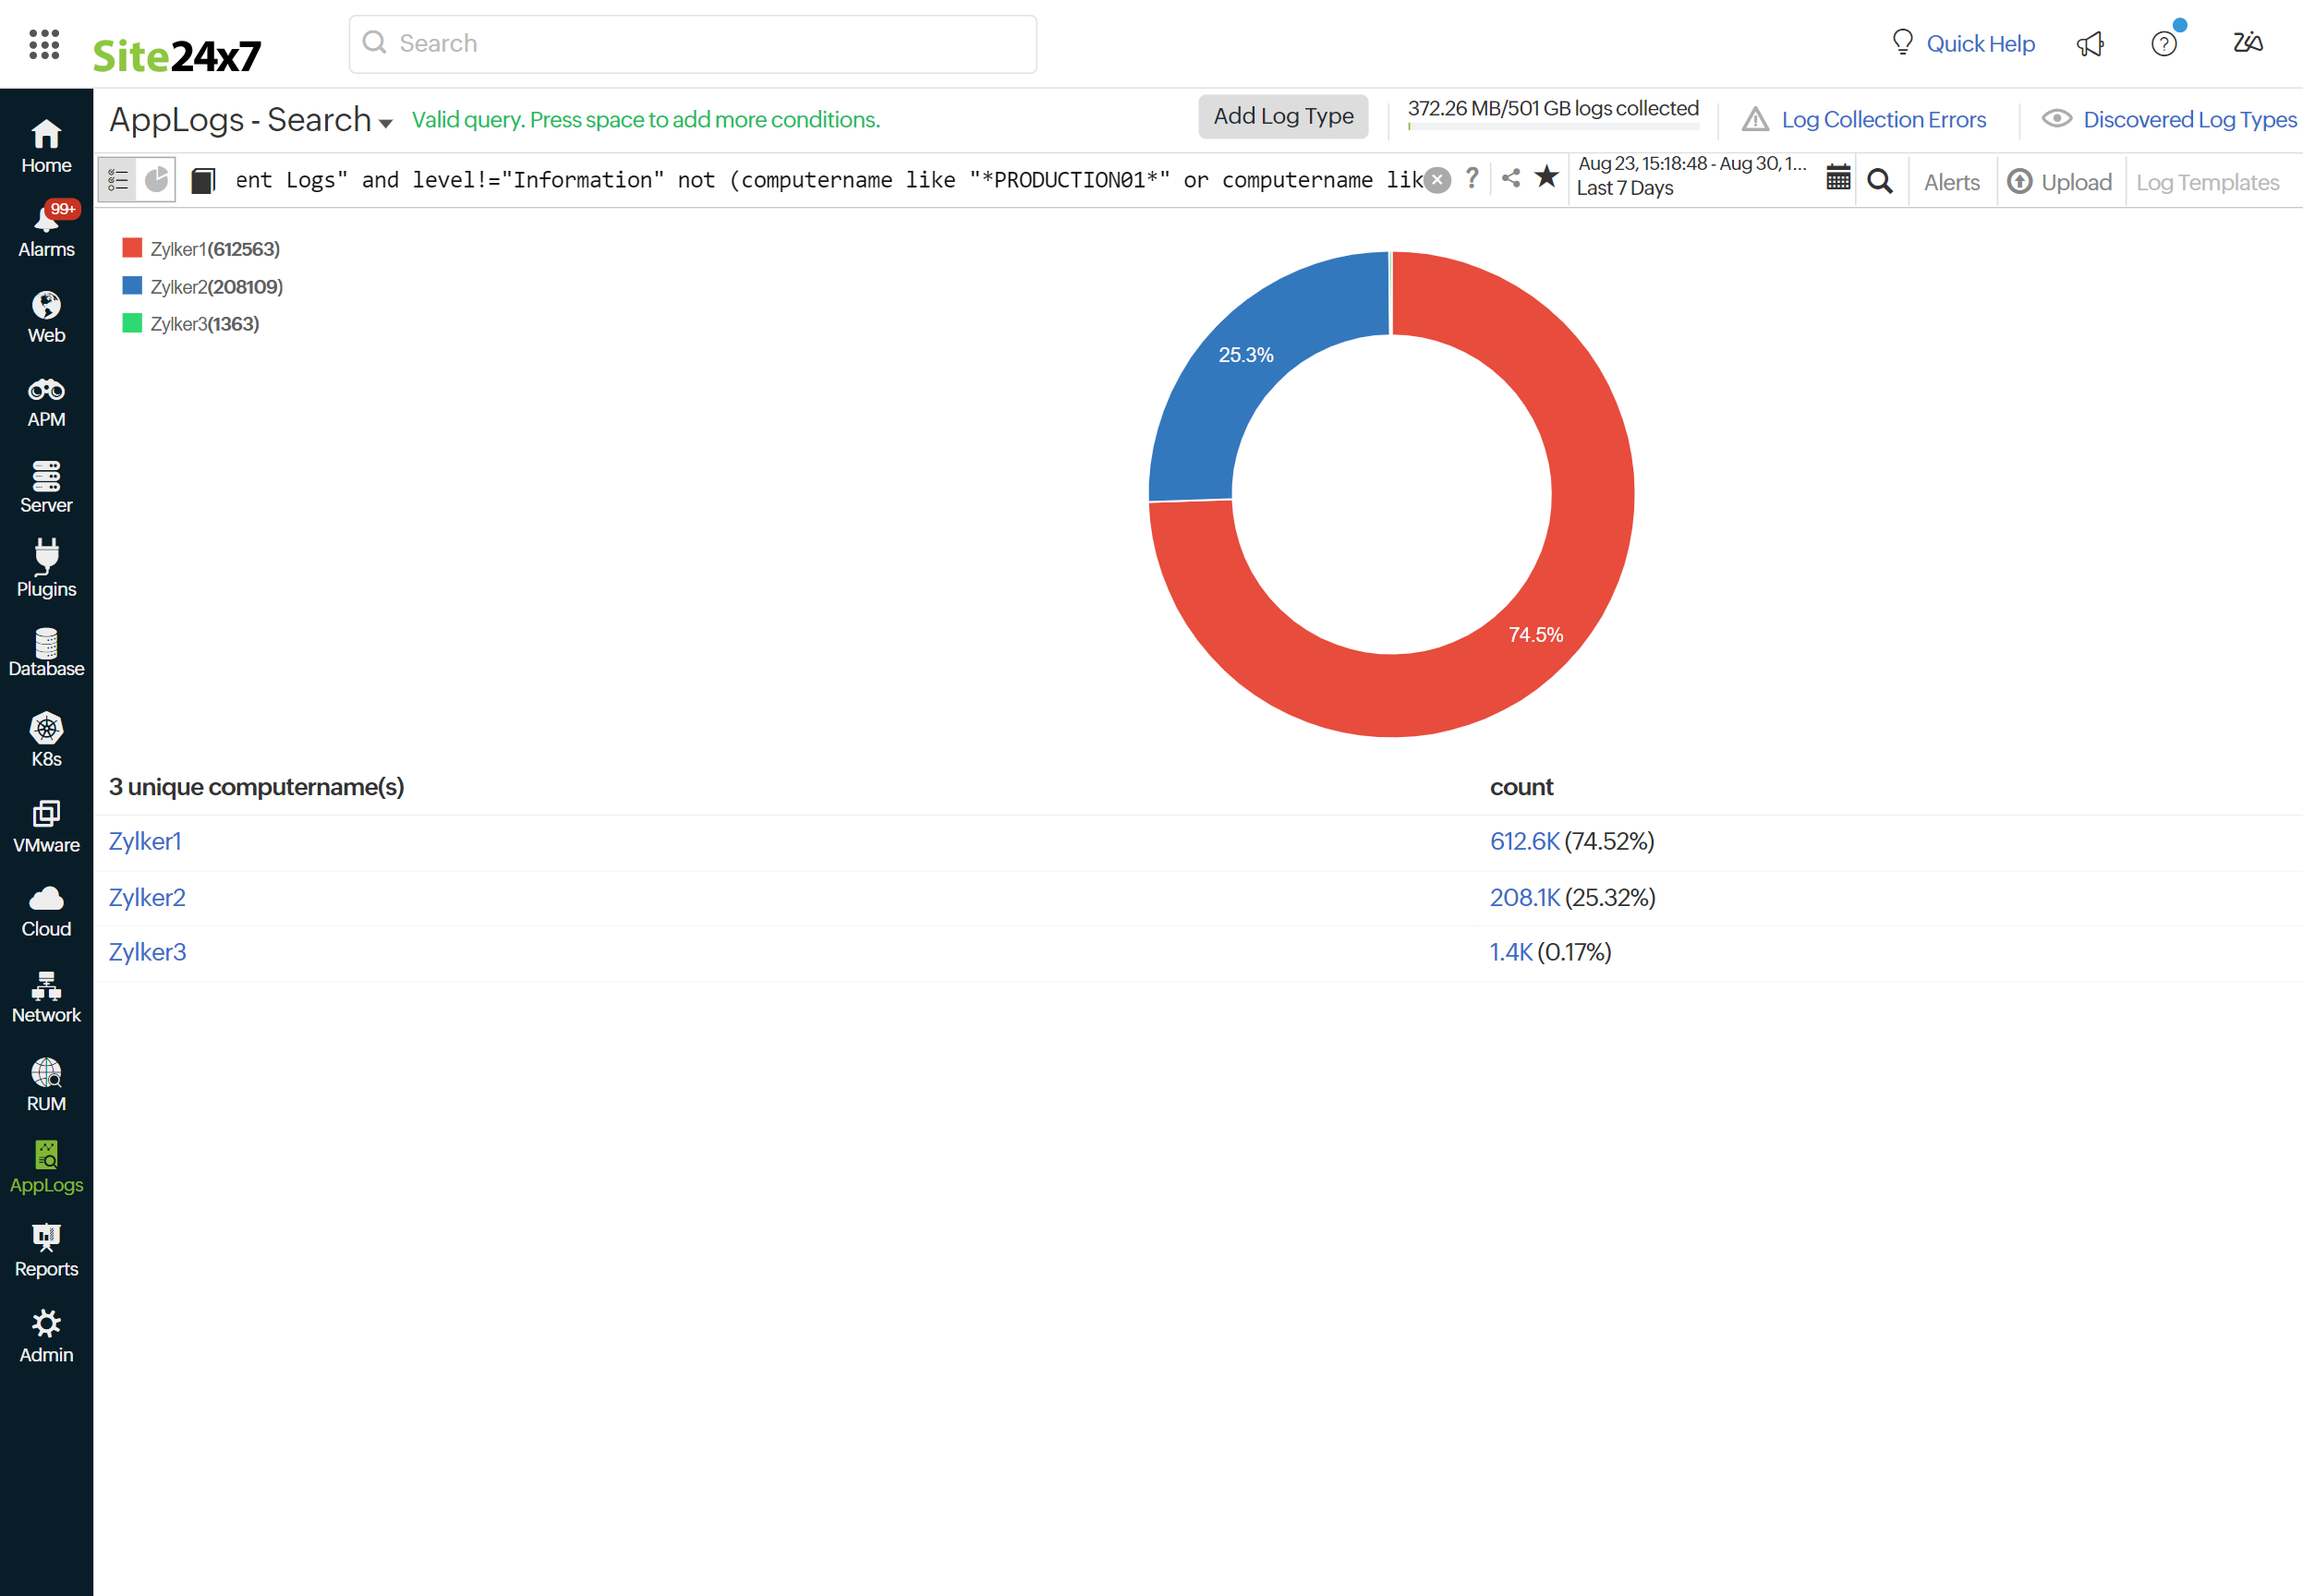
not:
Returns a value that excludes specific results from the query.
logtype="Windows Event Log" and level!="Information" not (computername like "*PRODUCTION01*" or computername like "*production1*") groupby computername
This query fetches all log entries from the Windows Event Log where the level is not "Information" and the computer name does not contain "PRODUCTION01" or "production1".
Recent searches:
You can reuse the recent search from our Recent Search History instead of typing it every time. You can view them by following the steps below:
-
- Click the
 icon in the search box.
 - You can view your recent search queries below the saved searches. You can also save your search queries for future use.

- Click the
Auto-value suggestion
With auto-value suggestions, you can dynamically adjust and modify your queries in real time using the most relevant field values. The system automatically recommends up to a thousand frequently occurring values for each field, enabling more accurate filtering and efficient troubleshooting.
To use auto-value suggestions, follow these simple steps:
- Navigate to the AppLogs tab.
- Input a search query (e.g., logtype="Automation Logs").
- As you type, the system will automatically suggest field names and their field values.
These value suggestions are available for fields that support the groupby query function, focusing on predefined values. You can choose from these suggestions to refine your query further.

Field Explorer
Modify queries in real time by adjusting your search results using field values in the Field Explorer. You can apply this by following a few simple steps:
-
Navigate to the AppLogs tab.
-
Input a search query (e.g., logtype="Nginx Access Logs").
-
Once the log results are displayed, access the Field Explorer from the left corner of the log output table to view field lists and the top five values of the log results.

NLP log search
The NLP log search feature uses Zia to convert plain English prompts into three structured query suggestions, so you can find relevant logs without writing query syntax.

Related articles:
- Supported log types
- Saving search queries
- Cluster messages based on pattern similarity using Log Templates
- AppLogs alerts
- Export and share logs
Further reading
Blog: 10 filter patterns that are helpful for managing your logs