Heroku Logs
Heroku lets you deploy, run, and manage applications written in several programming languages. Heroku’s Logplex router collects logs from your app and all other sources in Heroku (including dynos, routers, and runtimes). Logplex routes messages from sources to drains.
Heroku log drains support messaging via HTTPS and sends batches of data to an HTTPS endpoint via a POST request. You can configure your Heroku application to POST data directly to the URL for an HTTP source and start monitoring the data using Site24x7 AppLogs.
Prerequisites
Install the Heroku Command Line Interface to create and manage Heroku apps directly from the terminal.
Getting started with log management
- Log in to your Site24x7 account.
- Go to Admin > AppLogs > Log Types > Add Log Type.
- Select Heroku Logs from the Log Type dropdown.
- By default, this is the log pattern identified by Site24x7 AppLogs for Heroku application logs and Heroku router logs:
Log pattern
Sample logs* <*>* $Datetime:date:yyyy-MM-dd'T'HH:mm:ss.SSSSSSX$ host $Source$ $Dyno$ $Message$
The following are the sample logs for Heroku application logs and Heroku router logs:
90 <134>1 2022-11-16T18:49:08.498249+00:00 host heroku web.1 - State changed from up to down
290 <158>1 2022-11-21T18:13:27.538303+00:00 host heroku router - at=info method=GET path="/static/lang-logo.png" host=fathomless-taiga-38899.herokuapp.com request_id=a0c40543-6016-4ba1-8e16-201e7ee5b4b5 fwd="125.17.68.211" dyno=web.1 connect=0ms service=5ms status=304 bytes=159 protocol=https
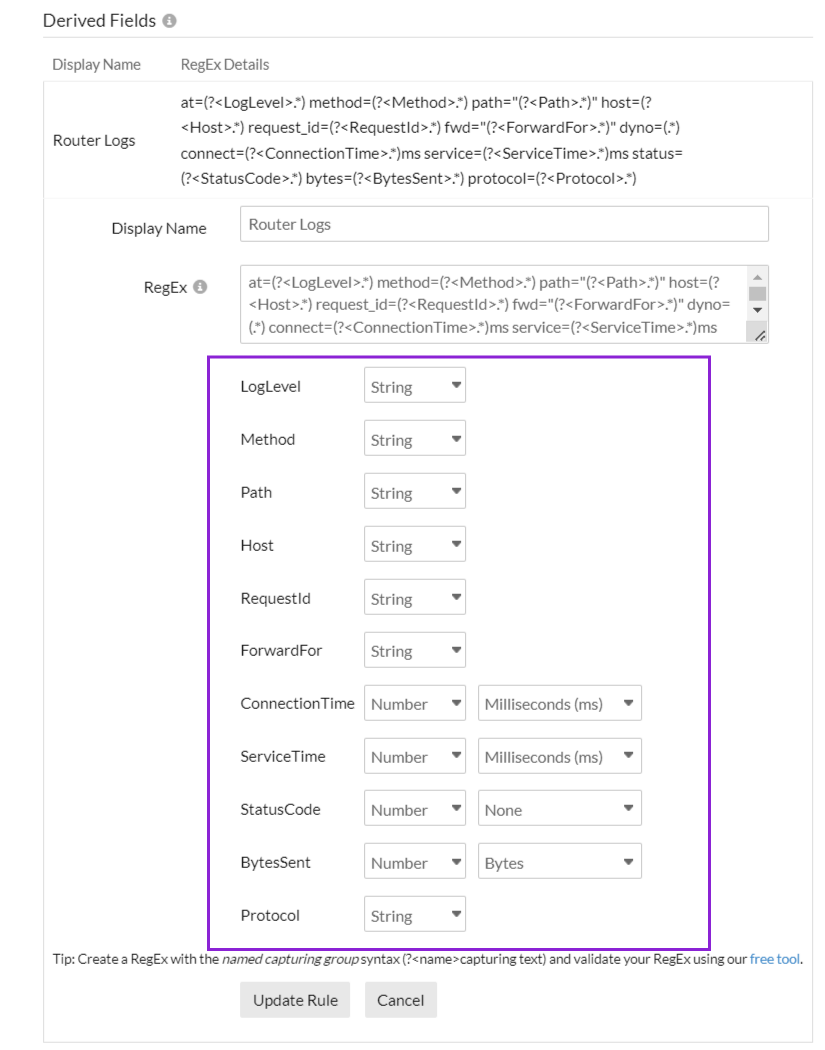
The sample log above can be separated into the following fields, each of which will take its respective value from here and will then be uploaded to Site24x7.
Using derived field support, the RegEx rule parses the Heroku router logs messages:Field name Field value Datetime 2022-11-21T18:13:27.538303+00:00 Source heroku Dyno router Message - at=info method=GET path="/static/lang-logo.png" host=fathomless-taiga-38899.herokuapp.com request_id=a0c40543-6016-4ba1-8e16-201e7ee5b4b5 fwd="125.17.68.211" dyno=web.1 connect=0ms service=5ms status=304 bytes=159 protocol=https 
- Copy the URL under the API Upload. You must provide this URL when setting up the HTTPS drain command. You can either copy the token alone to replace it in the drain command or copy the entire API endpoint URL, as shown in the screenshot, and paste it accordingly.

- Save the log type.
Enable logs in Heroku
Next, open the Heroku command line, then execute the below command:
heroku drains:add "https://logc.site24x7.com/event/receiver?rawLogs=true&token=<Token>&logSource=<CustomAppName>" --app <ApplicationName>
The above command has three sections:
- https://logc.site24x7.com/event/receiver?rawLogs=true&token=<Token>: This is the API endpoint URL. As mentioned in Step 5 above, you can either replace the token key or enter the complete URL copied from the Site24x7 console and paste it into the drain command.
- <CustomAppName>: This is the custom application name you give to identify your app.
- <ApplicationName>: This is your Heroku application name.
After completing the above steps, Heroku will start sending the logs to Site24x7 AppLogs.
Heroku dashboard
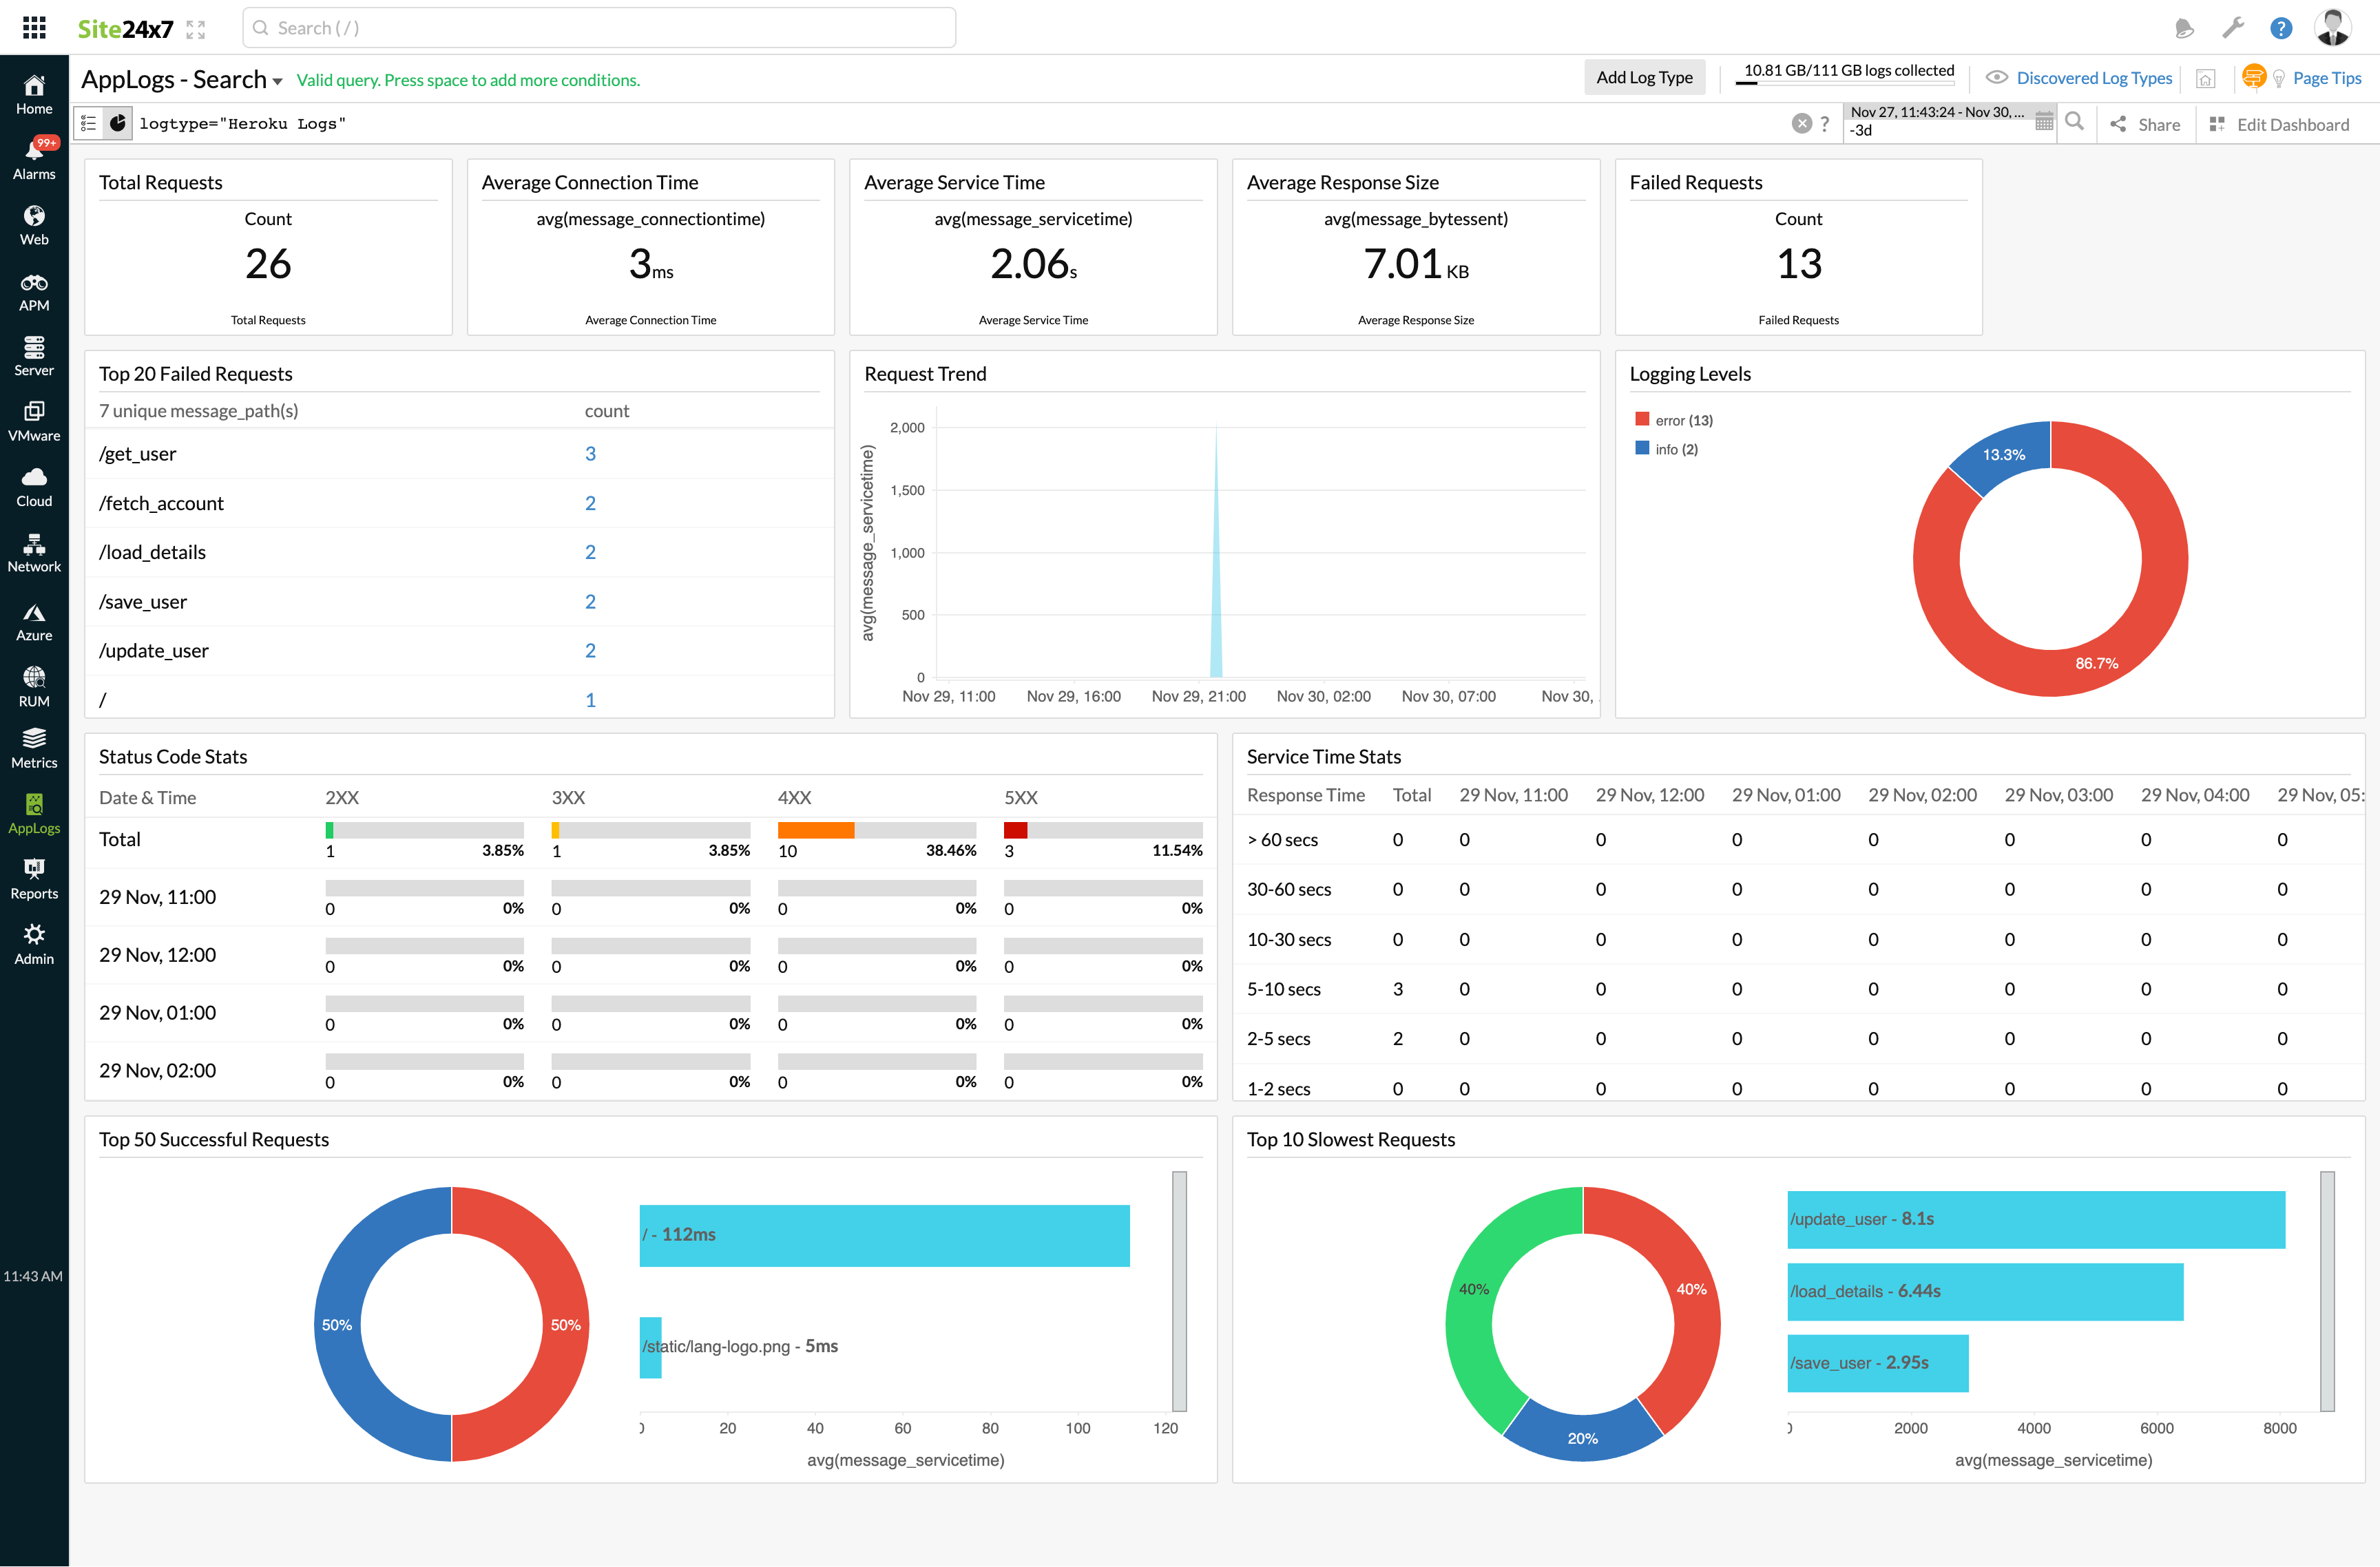
Here is a list of the widgets that are available by default on the Heroku dashboard:
- Total Requests
- Average Connection Time
- Average Service Time
- Average Response Size
- Failed Requests
- Top 20 Failed Requests
- Request Trend
- Logging Levels
- Status Code Stats
- Service Time Stats
- Top 50 Successful Requests
- Top 10 Slowest Requests

