Performance metrics for SaaS Synthetics (Browser)
By using SaaS Synthetics (Browser) monitors, you can gain valuable insights into your SaaS applications. Add and save your monitor details first, and then you can access the metrics. These monitors enable you to track the availability and performance of your SaaS-based applications. Metrics like availability and performance are presented in an easy-to-understand graphical and tabular layout. Key metrics like transaction time and page load time are captured from various locations and graphically interpreted for easy assimilation, ensuring efficient and smooth operation of the SaaS-based applications.
Site24x7's SaaS dashboard has a custom status banner, which identifies the various configured monitors by segregating them based on their operational status and state. You can also view the number of operational monitors and alert credits remaining in your account. By clicking + Buy More link, you can purchase additional monitors and alert credits.
Usecase
Imagine your company uses Salesforce, a CRM SaaS platform that helps manage sales, marketing, customer service, support, etc. It is important to ensure that the application is always available for employees.
You can use SaaS Synthetics (Browser) monitoring to check the application's availability right from the login stage. You can set thresholds for the application and verify that it is always functional. When the application experiences downtime, immediate actions can be taken by examining the application's metrics through the SaaS Synthetics (Browser) monitor and assign technicians to resolve the issues and restore the application's functionality.
Quick summary and events timeline
A quick summary gives you insight into metrics like: Availability, Page Load Time, Transaction Time, Downtime, Downtime Duration, and the SLA Achieved. The events timeline widget records all the past events of your selected monitor for a specified time range. You can identify/decode various past events, including Down, Critical, Trouble, Maintenance, Suspended, or Anomalies. Each event is color-coded for easy identification, which you can use to extract maximum data to enable easy troubleshooting. You can also track the actual outage period and the total outage duration during a specific block of time.

You can gather deep insights on the following performance metrics:
Transaction Time (ms): It defines the time taken to finish the entire recorded transaction, from the first step to the last step, in milliseconds. Transaction time is a combined calculation of the response time and the Think time. The Think time acts as a buffer or a wait time before starting the next step of the playback. Think time is primarily needed for steps involving AJAX calls.
Transaction Details: It defines the steps involved in a transaction. Each step contains the step details along with the screenshot, Step Time (ms), Page Load Time (ms), and Page Summary (HTML and resources).
Page Load Time By Location (ms): This defines the total time taken to load the HTML and all its associated components, including JavaScript and images, for an individual step in the transaction. It provides the steps and the time taken for each location.
Availability and Page Load Time by Location (ms): It offers a graphical and tabular interpretation of the availability and average location-wise page load time data in milliseconds.
Transaction time
The transaction time is a combined calculation of the page load time and the time taken to perform an action such as click, mouse-over, etc in each step of the entire transaction.
- The Transaction Time graph provides you with the entire time data (in milliseconds) taken to finish the entire recorded transaction, from the first step to the last step.
NoteThe step time is the sum of the page load time for a step and the sum of the action execution time.
(Step Time = Page load time for a step + SUM (Action execution time))
Transaction time is the summation of all the step time.
Transaction time = SUM (Step Time) - The graph is created by plotting the time-period against the total transaction time. You can generate graphs by specifying the granularity as raw or hourly.
- Further, you can filter out the three-point moving average, five-point moving averages, and 95 percentile by selecting the appropriate legends.
- Percentiles in Site24x7 can be used to identify outliers. Outliers are the data points or the set of data points that differ from the data set to indicate the anomalies. The 95th percentile represents a value that is greater than or equal to 95% of the observed values of your polled data during the selected time range. In simple terms, it means that 95% of the responses were faster than this value.
- The graph also lets you zoom in and extract data from the graphical spikes.

Transaction details
Transaction details provide comprehensive insights into your SaaS application performance. This includes options such as screenshots of each step, step time, page load time, step names, resource-level waterfall charts for each page, and any console errors that occurred during each step.
- Steps provide the details of individual actions performed on the SaaS applications. They provide screenshots of actions that can be utilized to assess the performance of each step and how the SaaS application loads.
- Step Time allows you to analyze the time taken for page loading and the time required for specific step actions.
- Page Load Time is useful for analyzing the time taken by each page in the transaction.
- Page Summary is useful for analyzing the resources used in each page and also provides the HTML of each step. Clicking on Resources provides the waterfall chart.
Waterfall chart
Webpage resource-level waterfall charts are valuable tools that help analyze the performance of each component on a webpage to understand performance issues by providing a visual representation. The waterfall chart provides the following information:
| Page Resources Summary | Unsecure Links, CDN Hits, DNS Time, Connection Time, First Byte Time, Start Render, Document Complete, and Page Load Time |
| Webpage Summary | No. of Requests, Total Objects, Images, Java Scripts, CSS, and Total Page Size |
| Content Breakdown by Requests | How many requests were raised for each resource. |
| Content Breakdown by Size | Split-up of resources based on the size. |
| Name of the Resource | Status Code, HTTP Version, Size of the Resource, and Time to Load the Resource |
| Domain Summary | Domain, IP Address, No. of Requests, Page Load by Location |
| Down/Trouble History | Start Time to End Time |

Page load time by location
The page load time by location provides the time in milliseconds for all the locations for each step in a transaction. The data is displayed in tabular format.
Clicking on the time will redirect you to the Attribute Report tab.
-
Attribute report
The attribute report provides a graphical representation of the page load time.
-
- The graph showing page load time by location provides a quick overview of the overall page load times for the step in a transaction over the selected time-period. The initial graphical representation displays the page load time, DNS time, and first-byte time.
- The second graph shows the 95th percentile of the load time for each action. You can calculate the average and 95th percentile values from the data collected at different monitoring locations. You can use the location legends to filter out the page load time specific to each location, making it easy to manage and compare.

-
Geo Map
The Geo Map provides an visualization of your SaaS application’s global availability and performance by consolidating data from synthetic (browser-based) monitoring and RUM sources. It simulates user interactions with your SaaS application from multiple locations and combines this with real-user experience data. You can hover over different regions to view average page load time and other key metrics, helping you understand how your SaaS application performs across geographies.
With the Geo Map, you can quickly identify regions experiencing slow page loads or transaction delays, detect failures in user workflows, and correlate synthetic browser data with real-user performance. This helps determine whether issues are localized or widespread, enabling faster detection and resolution of performance bottlenecks.
View by metrics
Select a metric to visualize availability and performance across locations. The Geo Map dynamically updates based on the selected metric, allowing you to analyze trends and compare synthetic and real-user experiences.
- Response Time: Displayed using color gradients (green for faster performance and red for slower). Bubble size increases with higher response time and decreases with faster execution, helping you identify latency-prone regions.
- Synthetic: Shows response time and transaction time captured using browser-based monitoring from configured locations.
- RUM: Displays response time as a heat map at the country level based on real user interactions.
Hovering over a location displays a tooltip with average response time, availability, page views (for RUM), and additional performance metrics.
- Availability (%): Represents the success rate of synthetic browser checks and user interactions across monitoring locations. A color gradient (green for high availability, red for low) highlights regions experiencing failures, errors, or degraded performance. Hovering over a location displays a tooltip with availability details.
- Current Status: Indicates the real-time status of each monitoring location. The map shows whether the locations are up or down. This view helps you quickly assess the operational state of SaaS browser checks across all regions.
- Response Time: Displayed using color gradients (green for faster performance and red for slower). Bubble size increases with higher response time and decreases with faster execution, helping you identify latency-prone regions.
-
Updates
Updates display recent monitor updates. Clicking on the see more link allows you to view all the updates.

-
Down/Trouble/Critical history
It offers detailed insight into the Down/Trouble/Critical history of your monitor. You can view the status, the exact downtime (start time to end time), duration, and the specific reason for the Down status.
Click on the View RCA link to get the RCA report for your monitor's Down/Trouble/Critical history.NoteClick on the downtime Root Cause Analysis (RCA) report to know more.

When you click on the hamburger icon and select Mark as Maintenance, you can mark a record as being under maintenance. You can also add or edit a comment for a record by selecting Add/Edit Comments. If needed, you can click Delete to remove the record.
Root cause analysis (RCA) report
You can retrieve an in-depth RCA report for your Down monitors after 150 seconds of the monitor reporting the outage. RCA Report gives basic details about your monitor, outage details, recheck details, and reasons for the outage. RCA automatically generates a plethora of information to arrive at a definite conclusion as to what triggered a downtime. RCA intends to determine the root cause of specific downtime or performance issues. A normal RCA report includes these details:
- Checks from the Primary location and rechecks from the Secondary location.
- Resource-level Waterfall Chart
- Console Errors
- Video: A video to help analyze the steps and issues that are arising.
- Compare screenshots and HTML
- Ping Analysis
- DNS Analysis
- TCP Traceroute
- MTR Report
- MTR-based Network Route
- Conclusion
Read this article on RCA to learn more about the various network diagnosis reports.
-
Compare screenshots and HTML
You can use this option to check the difference between screenshots, HTML, and resources in the RCA report. The old responses will be on the left, and the new ones will be on the right.
This feature is helpful for identifying any changes in the web application. For example, if your company uses an application and an update makes it inaccessible to users, this feature can help pinpoint where the issue is occurring, and you can allocate developers to fix it promptly rather than having to debug the entire application.
- Screenshot comparison: This feature allows you to compare a screenshot taken when the monitor transaction step was up with a screenshot from when the monitor transaction step was Down. It also provides the date and time of each screenshot. Comparing the screenshots will help you identify any differences.

- HTML comparison: This option lets you compare the HTML code of the application or webpage from when it was up recently to when it was Down to analyze any change. Added lines are highlighted in green, while removed lines are highlighted in red. You can use the Prev Diff and Next Diff functions to move between the differences in the HTML. This makes it easier to spot variances in the HTML content.

- Screenshot comparison: This feature allows you to compare a screenshot taken when the monitor transaction step was up with a screenshot from when the monitor transaction step was Down. It also provides the date and time of each screenshot. Comparing the screenshots will help you identify any differences.
Availability and page load time by location
The availability and page load time of the Web Transaction (Browser) for every monitoring location is expressed in a tabular format. This data can be used to deduce the total availability percentage and Page load time (sec(s)) with Down duration for each monitoring location.

Apdex Score
Our real user monitoring integration widget allows you to instantly measure a user’s satisfaction with your application or service using the industry-standard Apdex metric. This helps you understand how your applications are performing from the user's perspective, categorizing their experience as "Satisfied", "Tolerating", or "Frustrated". You can choose the time-period from the historical data section.
The Apdex Score is a measure of end user customer satisfaction levels and is classified as follows:
- Apdex score > 0.9 means Satisfied.
- Apdex score > 0.5 to <0.9 means Tolerating.
- Apdex score < 0.5 means Frustrated.
Industry average for media
The global industry average is helpful for bench-marking performance. The benchmark widget is now integrated within the client, allowing you to compare your SaaS application's performance with industry peers. With our performance bench-marking widget, you can instantly view and compare your average response time and service availability with respect to your industry peers across verticals.


Outages
You can access the Outages tab on your Monitor Details page to gather detailed insights on the various outages and maintenance downtime. It provides you with sufficient information to troubleshoot issues. You'll also be able to access the root cause analysis reports for your various outages. On accessing the icon for a listed monitor outage or maintenance, you will be shown the options to:
- Mark as Maintenance: Mark an outage as maintenance
- Add/Edit Comments: Add or edit Comments
- Delete: Delete an outage or maintenance permanently

Inventory
This section covers the essential monitor information and its various configuration settings, such as polling locations, poll interval, licensing type, and more.

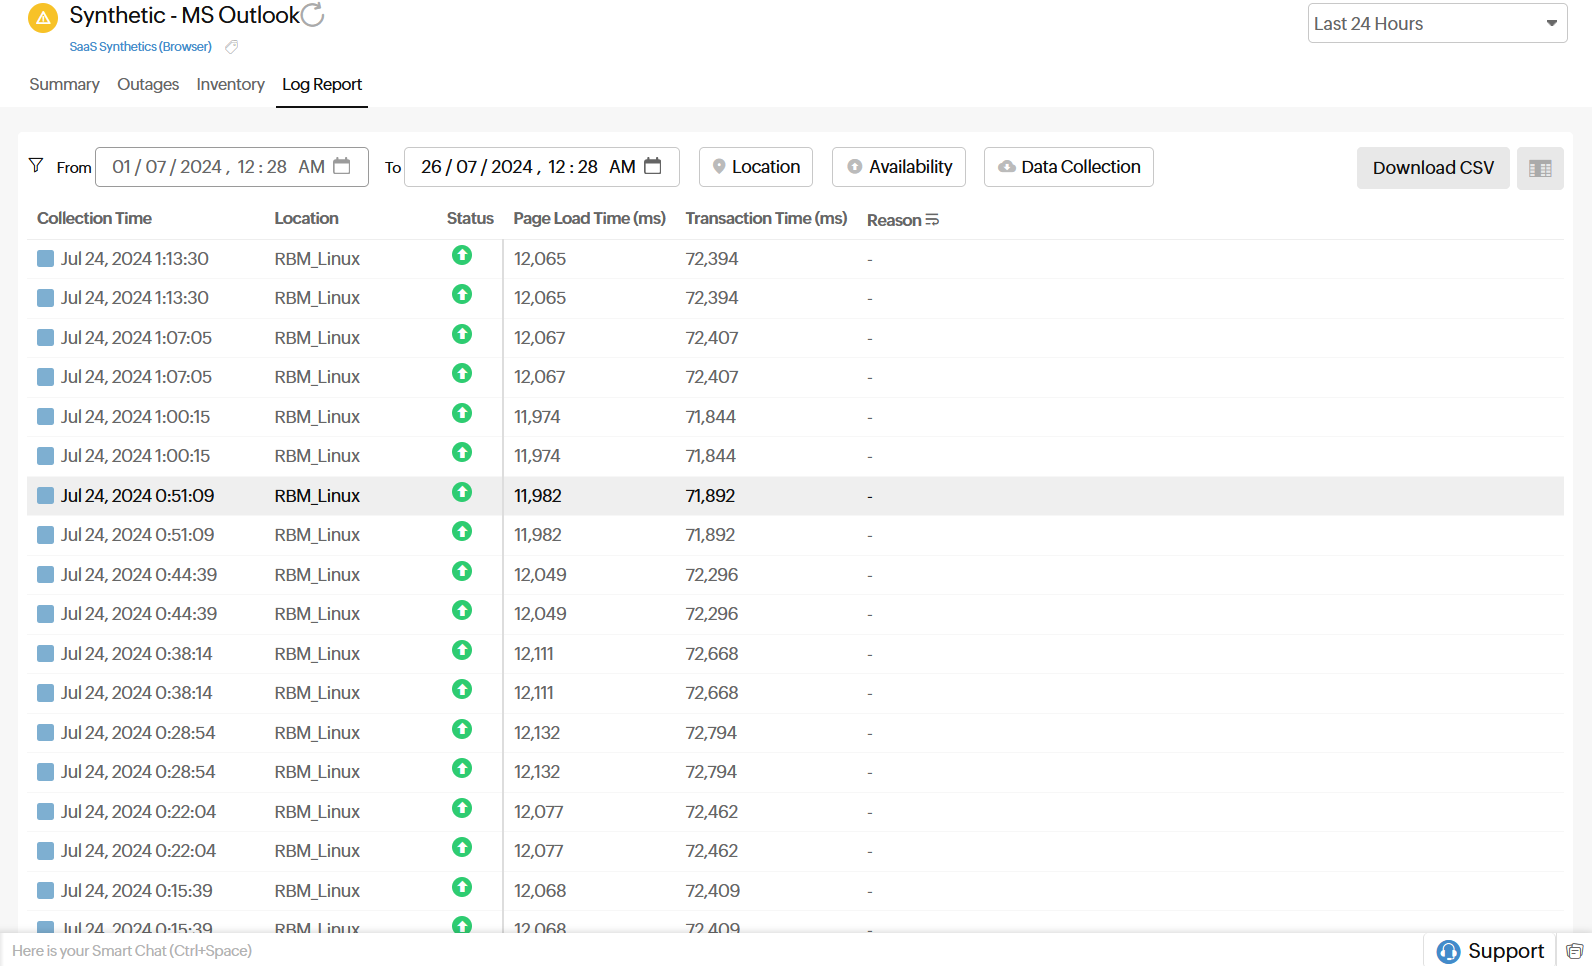
Log report
With our integrated log records for individual monitors, you can get in-depth knowledge about the various log details for the configured monitor over a custom period. You can also filter the log based on location and availability. Multiple data, including availability status, HTTP status codes, DNS response time, etc., are captured here. You can also export the log report in CSV format.