Cisco ACI monitoring
Cisco Application Centric Infrastructure (ACI) is a software-defined networking (SDN) solution that provides complete visibility over your physical and virtual network components. It is primarily used to streamline data center operations. Site24x7 allows you to monitor your Cisco ACI networks through REST APIs and obtain complete visibility into your Application Policy Infrastructure Controller (APIC), fabric, tenants, and endpoint groups.
Common terms
- Cisco APIC: The main architectural component that is the unified point of automation and management for the Cisco ACI fabric.
- Fabric: Comprises discrete components that are connected in a spine and leaf topology, managed as a single entity.
- Spine: Spine switches act as the backbone of the ACI fabric and help connect all the leaf nodes.
- Leaf: Access switches that aggregate traffic from servers and connect to the spine.
- Tenants: Within the ACI fabric, a tenant provides logical segmentation to isolate different sets of resources, such as networking, computing, and storage, while sharing the same physical infrastructure.
- Endpoint Groups: An endpoint is a single network device connected to the network directly or indirectly. An Endpoint Group (EPG) represents a group of endpoints, such as virtual machines, servers, or applications, that share common policy requirements.
Prerequisites
- An On-Premise Poller (version 5.6 and above) must be installed on the device from which the Cisco ACI network will be monitored.
- The On-Premise Poller and the Network Module must be up and running.
- Correct credentials must be provided for connecting to the Cisco ACI network.
NoteCredentials and customer details are encrypted before being stored in Site24x7.
Use case
Imagine an organization trying to change the way it deploys and manages applications across its data center infrastructure. The challenges it would run into would be tedious manual configurations, network silos, and a lack of visibility into performance.
Cisco ACI uses a policy-based approach to automate and simplify network provisioning and management. It enables administrators to define policies that specify how applications should communicate and be managed in the network rather than dealing with individual network device configurations.
How it works
When you add a device to Site24x7, it connects to your Cisco ACI network using the credentials you provide. It then fetches data using the API for each monitor you add and displays it. Data is displayed at three levels for the fabric: Super Spine, Spine, and Leaf. You can also view details according to Tenants and Endpoint Groups.
Adding a Cisco ACI monitor
To begin monitoring, add your Cisco ACI networks to Site24x7.
Viewing the monitor summary
- Log in to your Site24x7 account.
- Navigate to Network > Cisco ACI Monitors.
- Click the required Cisco ACI monitor. The Summary page will open.
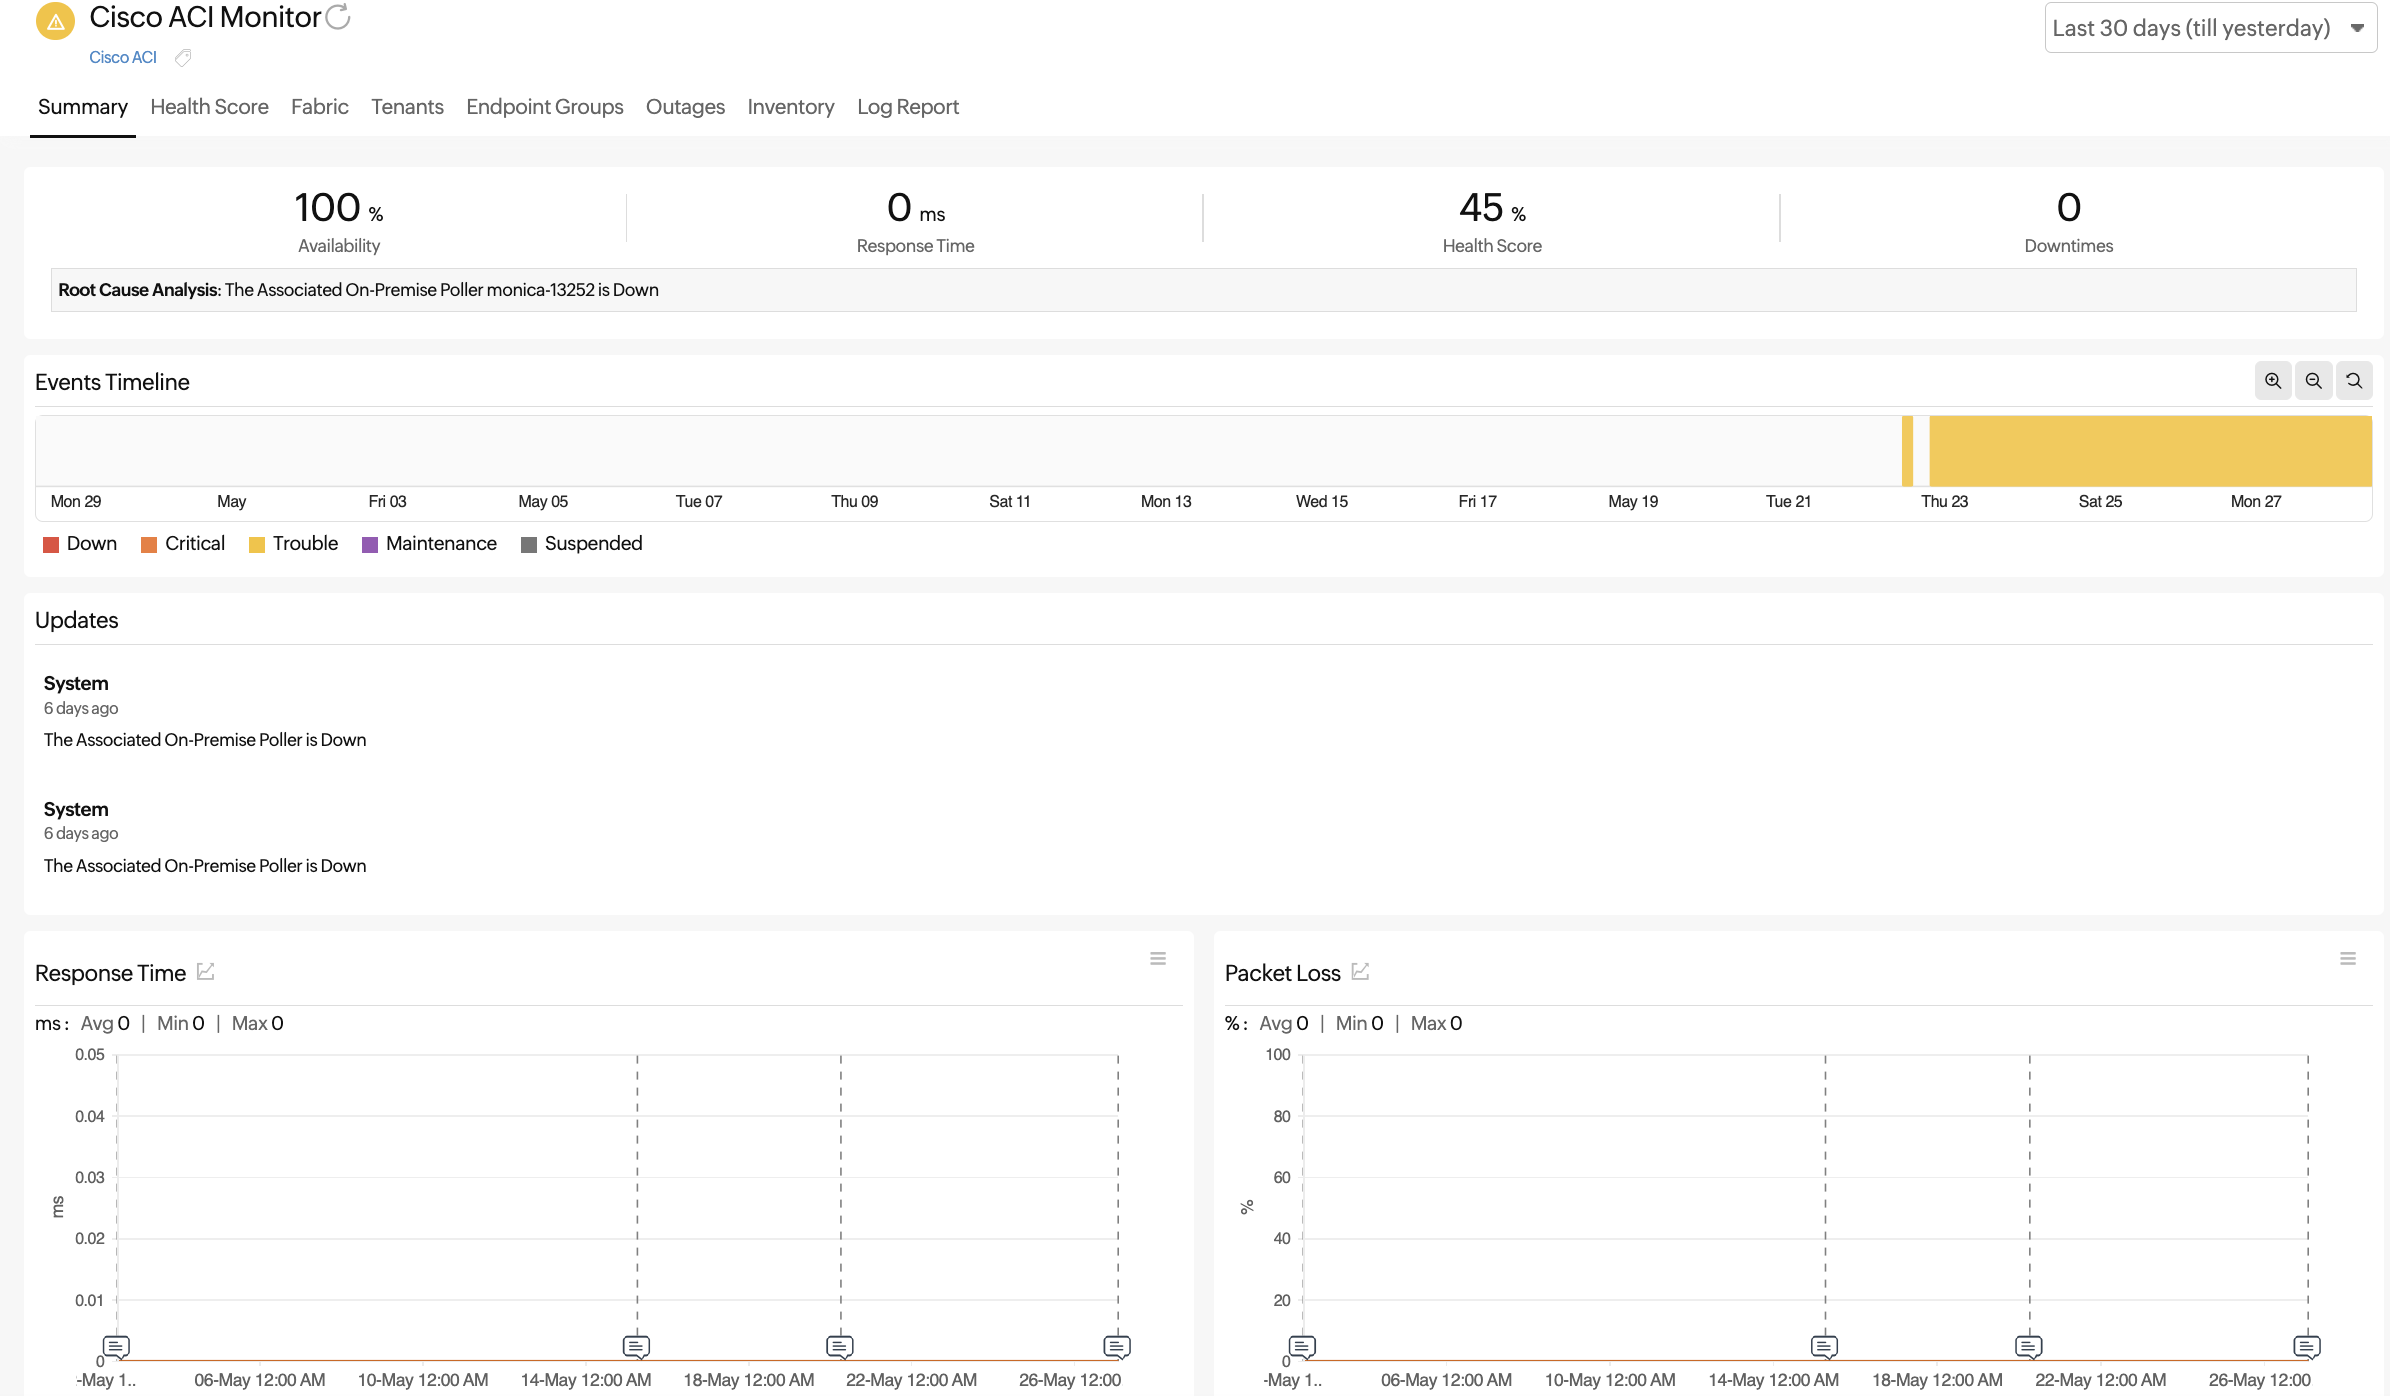
Figure 1. Summary page for a Cisco ACI monitor
Viewing the Health Score
In the Health Score tab, you can view the details for the ACI, fabric, and the tenants. You can also view the performance report for each one by clicking on the graph ![]() icon beside the name in each section.
icon beside the name in each section.
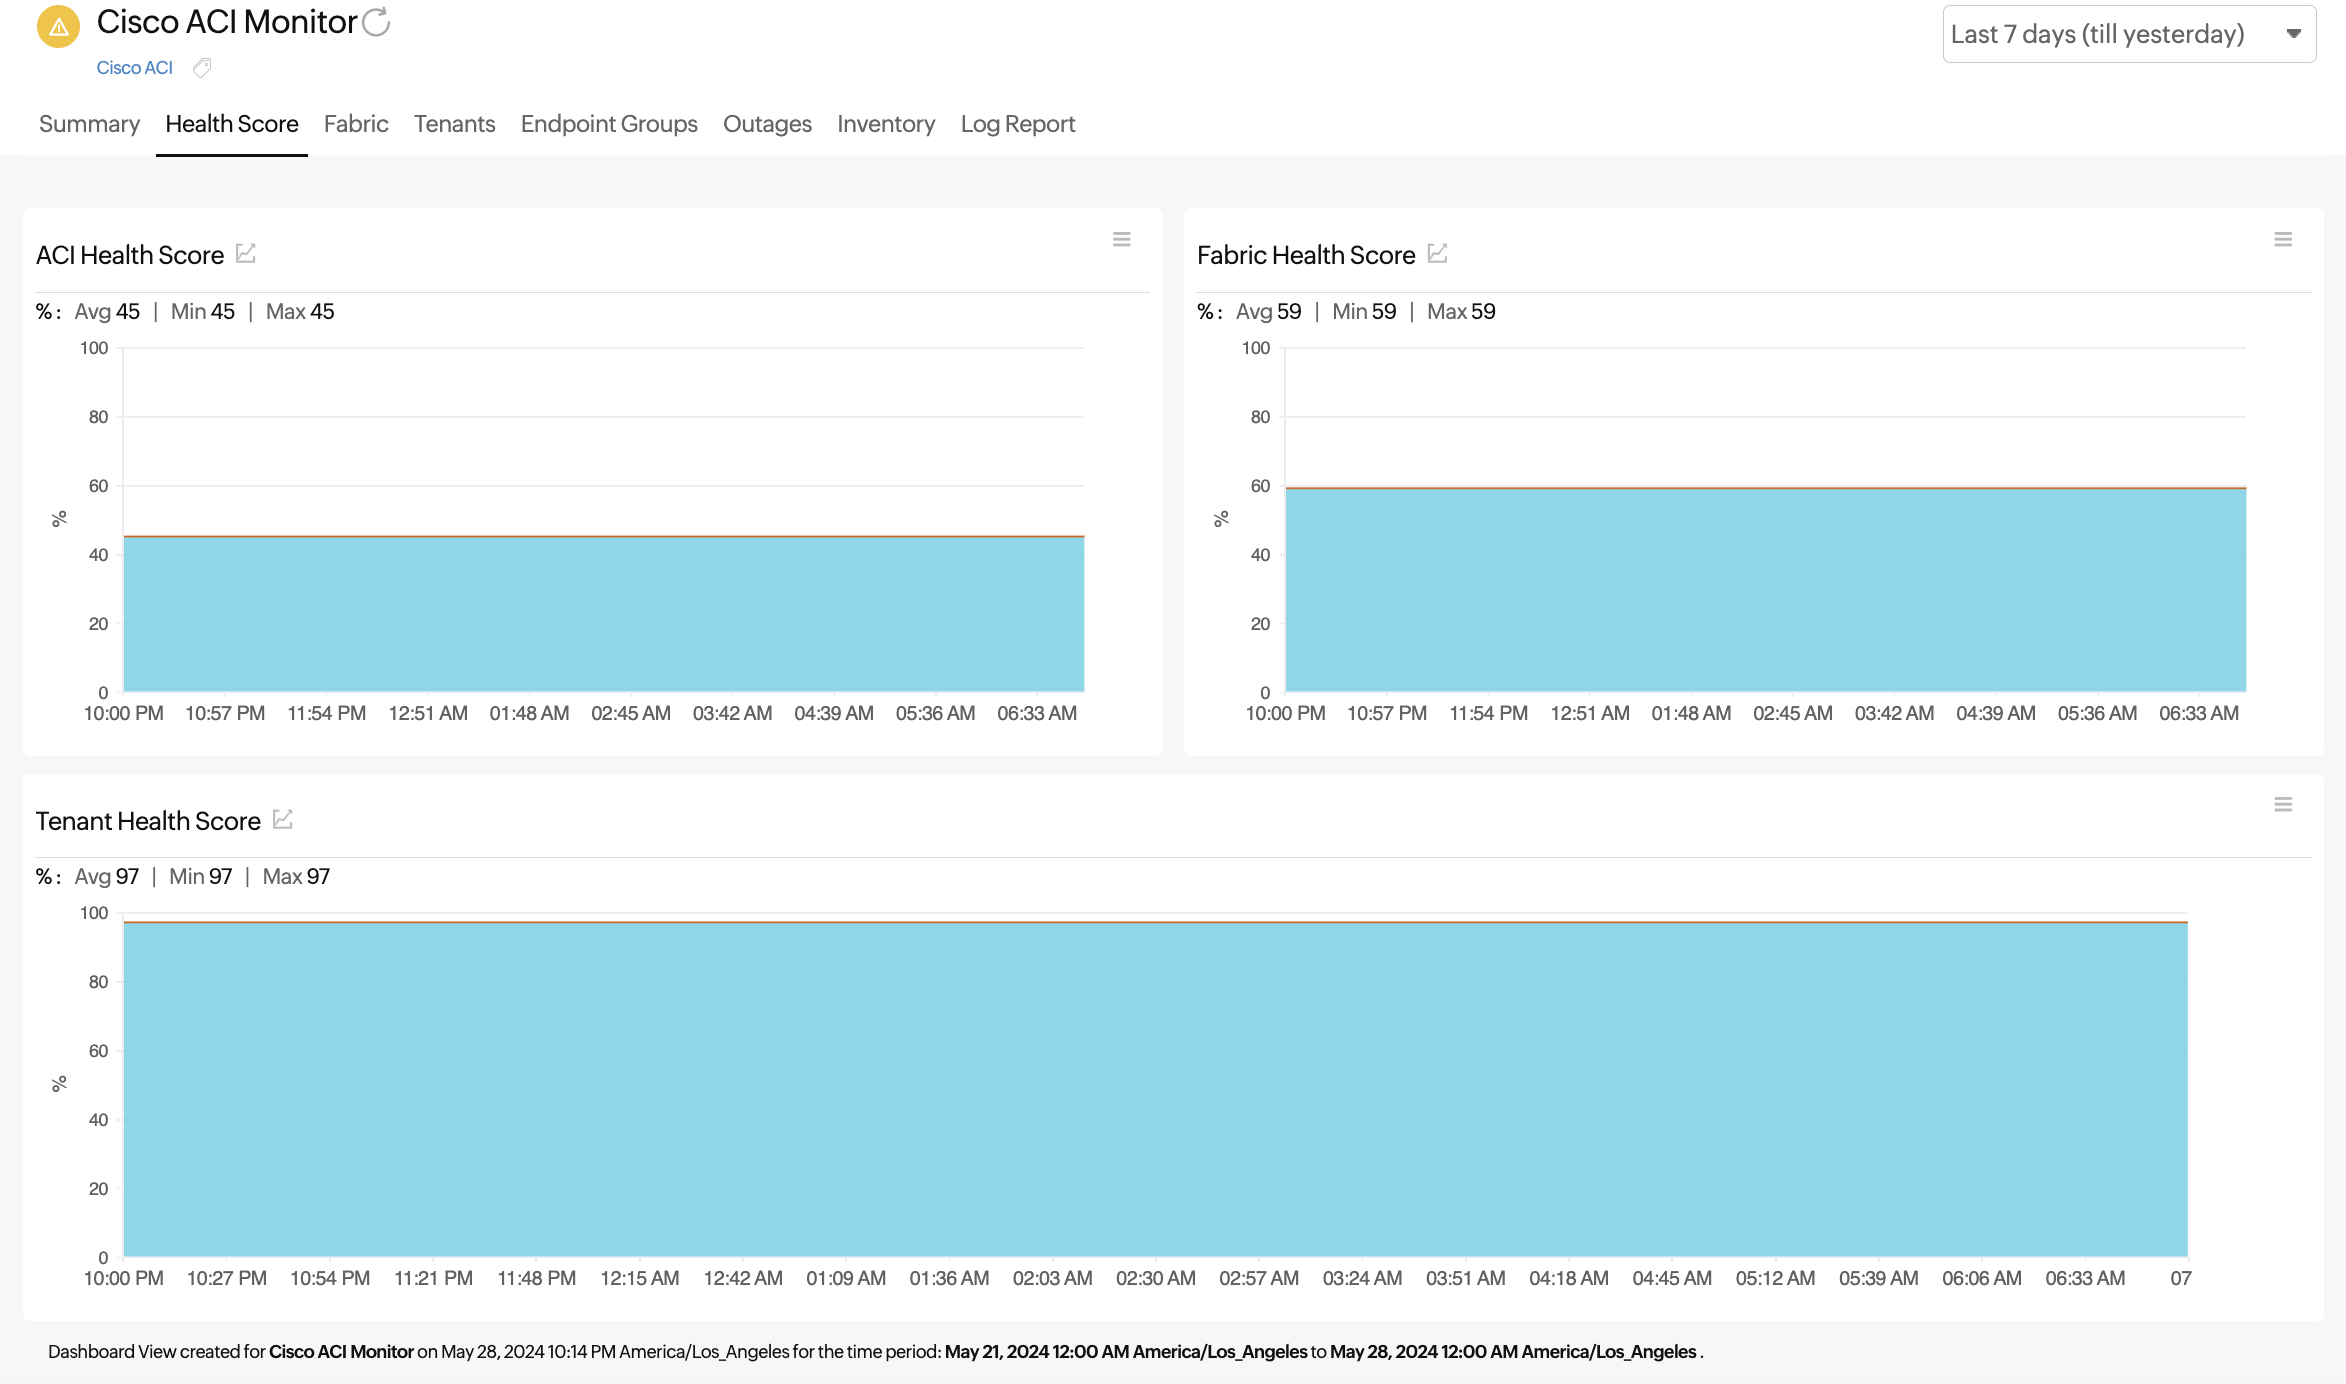
Figure 2. Viewing the Health Score
Fabric
View details about the Leaf, Spine, and Super Spine in the Fabric tab. Click the pencil ![]() icon beside each row to set the threshold for that entity (Figure 3, marked in blue) or click the Threshold Configuration button on the top-right of each section (Figure 3, marked in purple) to edit thresholds in bulk.
icon beside each row to set the threshold for that entity (Figure 3, marked in blue) or click the Threshold Configuration button on the top-right of each section (Figure 3, marked in purple) to edit thresholds in bulk.
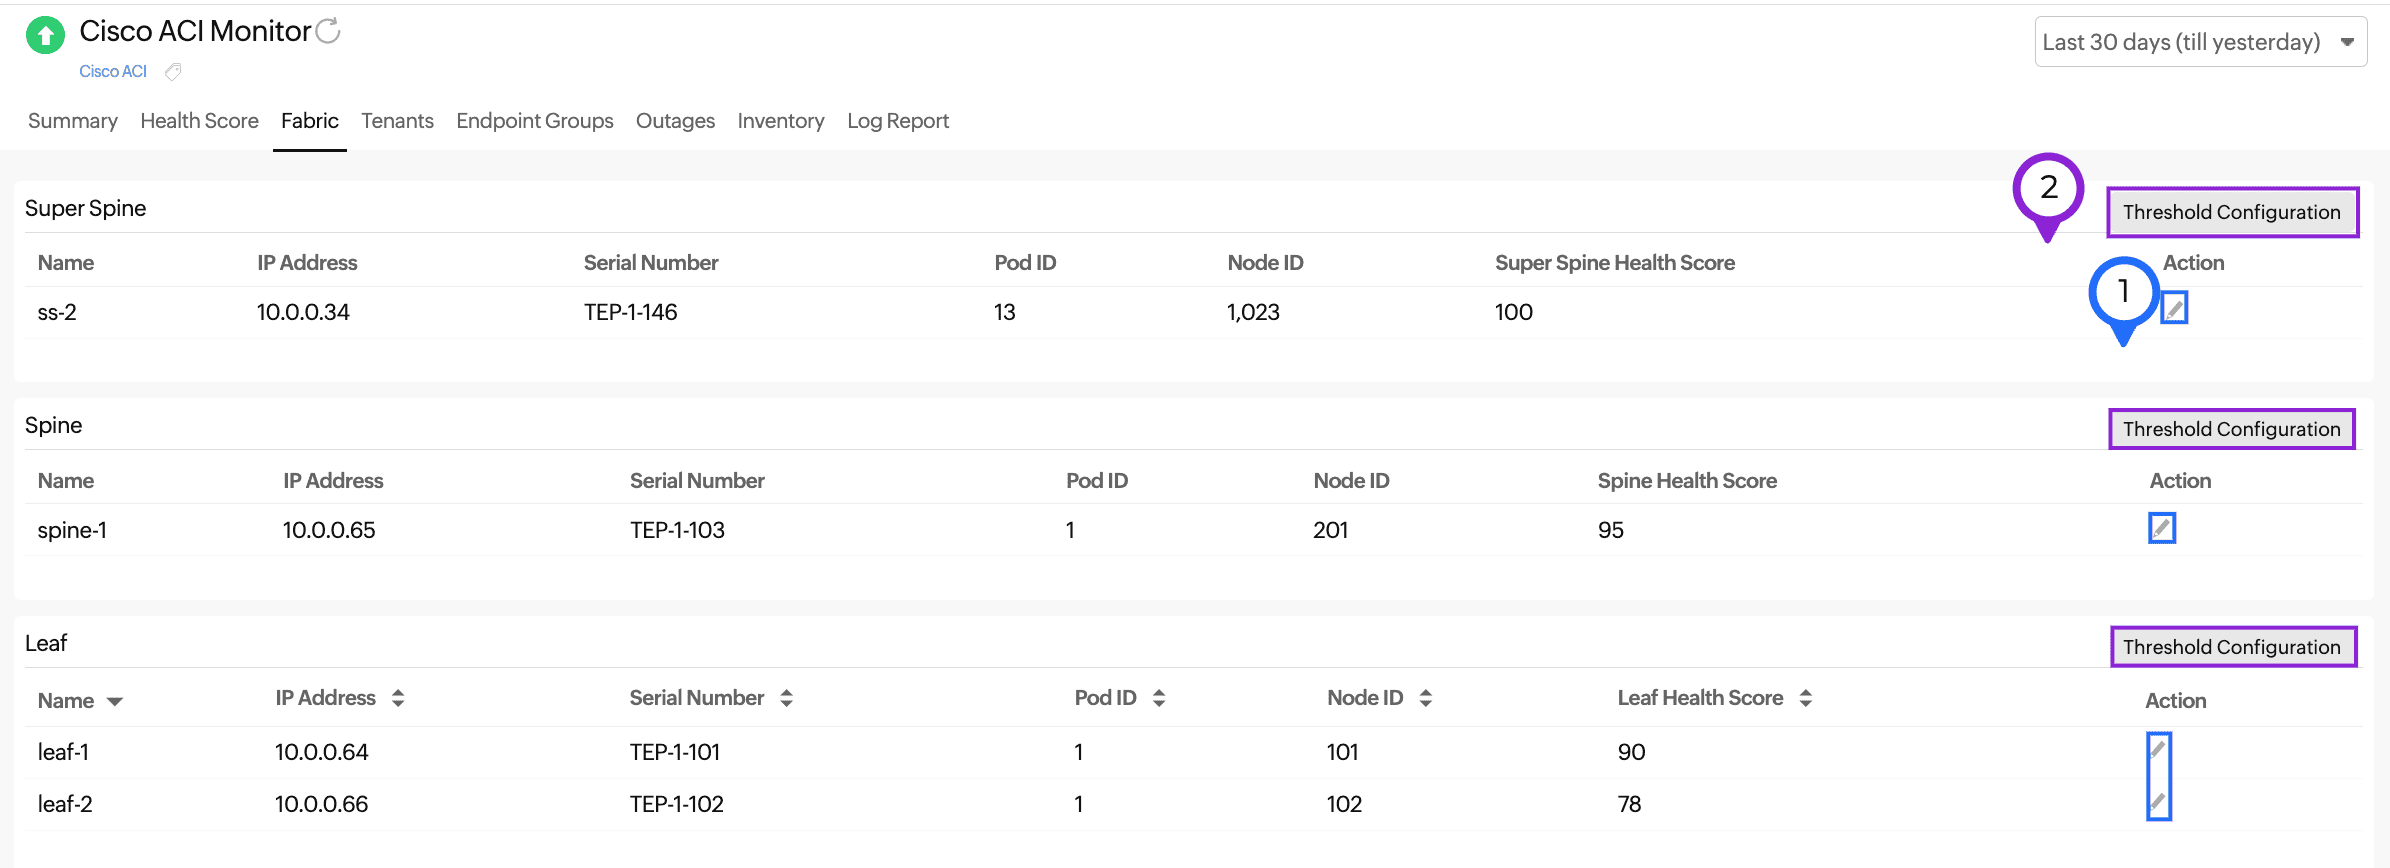
Figure 3. Viewing the Fabric Details
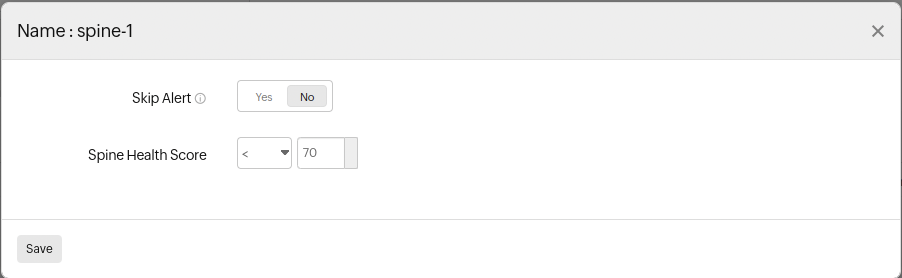
Figure 4. Click the pencil icon for a single entity (Figure 3, marked as 1)
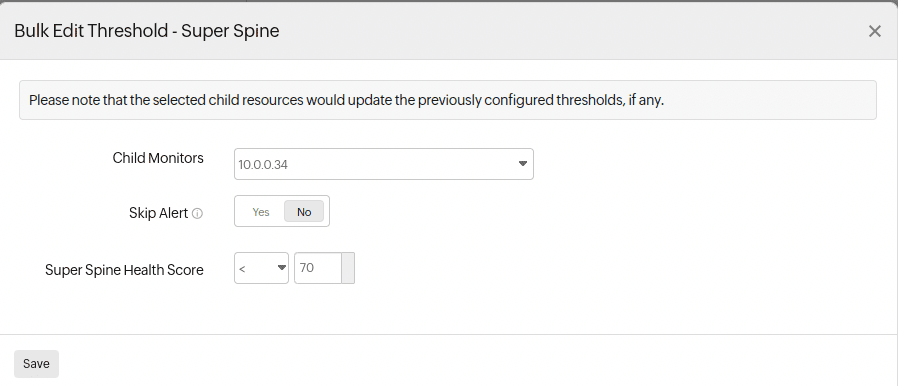
Figure 5. Bulk Edit Threshold (clicking on the item marked as 2 in Figure 3 will bring up this page)
Tenants
View all the tenants in the Tenants tab. Click the pencil ![]() icon beside each row to set the threshold for that entity (Figure 6, marked in blue) or click the Threshold Configuration button on the top-right of each section (Figure 6, marked in purple) to edit thresholds in bulk. You can also click on the name of each tenant to view more insights about each tenant (Figure 7).
icon beside each row to set the threshold for that entity (Figure 6, marked in blue) or click the Threshold Configuration button on the top-right of each section (Figure 6, marked in purple) to edit thresholds in bulk. You can also click on the name of each tenant to view more insights about each tenant (Figure 7).
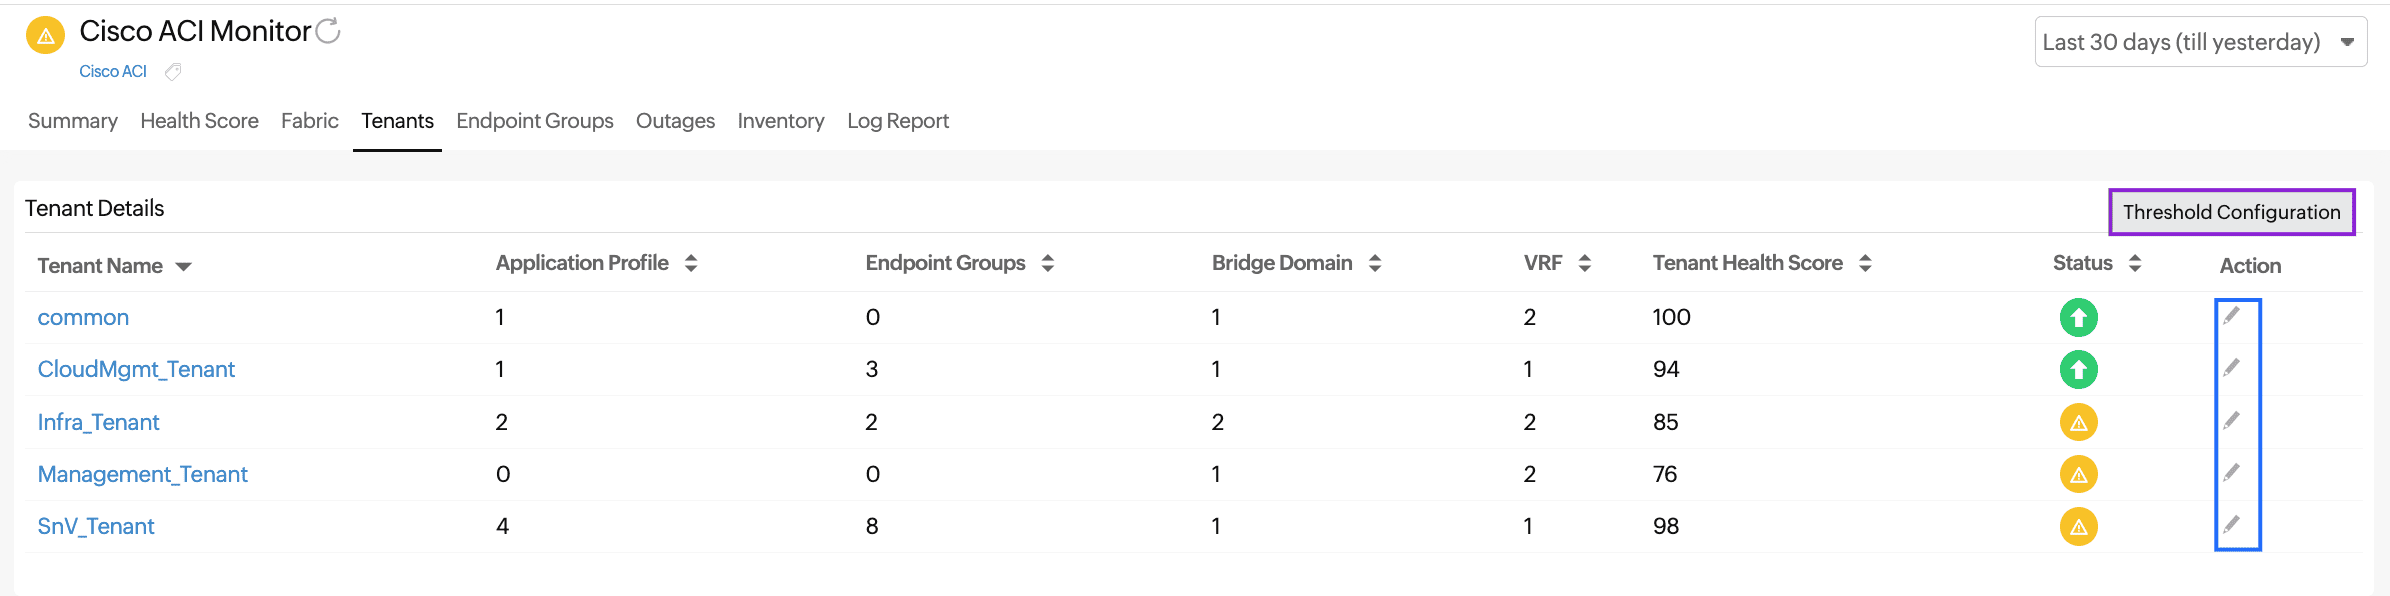
Figure 6. Viewing Tenant Details
End Point Groups
View the devices connected to the Cisco ACI network directly or indirectly according to the groups in which it is present.
Outages
View details about outages and click on a record to add comments as needed.
Inventory
View details about the Cisco ACI monitor such as Monitor Licensing Category,
Monitoring Locations, Threshold and Availability Profile, Notification Profile, and User Alert Group. You can edit the fields that have a pencil ![]() icon beside them. Start a group chat by clicking the chat icon. Add notes by clicking Add Note.
icon beside them. Start a group chat by clicking the chat icon. Add notes by clicking Add Note.
Log Report
View log reports filtered within a required time period and based on availability. Click Download CSV to download the report. Click the table ![]() icon to select the required columns.
icon to select the required columns.
Reports
Navigate to Reports > Cisco ACI to view the following reports:
You can also create custom reports by clicking Create Custom Report below all the available reports.