Monitor Azure AI Search
Azure AI Search, formerly known as Azure Cognitive Search, allows secure and scalable information retrieval across user content for traditional and generative AI applications.
With Site24x7's integration, you can monitor your resources with accurate metrics, including the in-depth Statistics (quota) metrics, configure thresholds, and get instant alerts if there is a breach.
Setup and configuration
Adding Azure AI Search while configuring a new Azure monitor
If you haven't configured an Azure monitor yet, add one by following the steps below:
- Log in to your Site24x7 account.
- Choose Cloud from the left navigation pane, and select Azure > Add Azure Monitor. You can also follow these steps to add an Azure monitor.
- During Azure monitor configuration, on the Add Azure Monitor page, select Azure AI Search along with other required resource types from the Service/Resource Types drop-down. Check if you have configured the corresponding resource groups and tag filters in the Edit page.
Adding Azure AI Search to an existing Azure monitor
If you already have an Azure monitor configured for the tenant, you can add the Azure AI Search using the following steps:
- Log in to your Site24x7 account.
- Navigate to Cloud > Azure and select the Azure monitor from the left pane for which you wish to add Azure AI Search.
- On the Service View page, click the Enable Monitoring button for the Azure AI Search service type. Check if you have configured the corresponding resource groups and tag filters in the Edit page.
It will take 15-30 minutes to discover new Azure resources. To immediately discover the selected configuration, click Discover Now in the top-right corner, and all the resources that match the filters configured on the Azure Edit page will be discovered even if the Auto-Discover New Resources option is disabled.
Now you can view the discovered resources from the Service View dashboard itself.
Polling frequency
Site24x7's Azure AI Search monitor collects metric data every minute and the statuses from your applications every five minutes.
Supported metrics
Forecasted metrics are denoted as (FM).
Performance
| Metric name | Description | Statistic | Unit |
|---|---|---|---|
| Search Latency (FM) | The average search latency for the search service | Average | Seconds |
| Search Queries per Second (FM) | The number of search queries per second for the search service | Average | Count per Second |
| Throttled Search Queries (FM) | The average percentage of search queries that were throttled for the search service | Average | Percentage |
| Document Processed (FM) | The number of documents processed | Sum | Count |
| Skill Execution Invocation (FM) | The number of skill executions | Sum | Count |
Statistics
Statistics metrics can be viewed only after updating the API key, as per this article.
| Metric name | Description | Statistic | Unit |
|---|---|---|---|
| Indexes | |||
| Indexes Usage | The number of indexes used | Sum | Count |
| Indexes Quota | The maximum number of indexes that can be added | Sum | Count |
| Indexes Usage (FM) | The average percentage of indexes used | Average | Percentage |
| Indexers | |||
| Indexers | The number of indexers used | Sum | Count |
| Indexers Quota | The maximum number of indexers that can be added | Sum | Count |
| Indexers Usage (FM) | The average percentage of indexers used | Average | Percentage |
| Data Sources | |||
| Data Sources | The number of data sources used | Sum | Count |
| Data Sources Quota | The maximum number of data sources that can be added | Sum | Count |
| Data Sources Usage (FM) | The average percentage of data sources used | Average | Percentage |
| Aliases Count | |||
| Aliases | The number of aliases used | Sum | Count |
| Aliases Quota Count | The maximum number of aliases that can be added | Sum | Count |
| Aliases Usage (FM) | The average percentage of aliases used | Average | Percentage |
| Skillset | |||
| Skillset | The number of skillsets used | Sum | Count |
| Skillset Quota Count | The maximum number of skillsets that can be added | Sum | Count |
| Skillset Usage (FM) | The average percentage of skillsets used | Average | Percentage |
| Storage | |||
| Storage | The amount of storage used | Sum | Count |
| Storage Quota Size | The maximum amount of storage that can be added | Sum | Count |
| Storage Usage (FM) | The average percentage of storage used | Average | Percentage |
| Synonym Maps | |||
| Synonym Maps | The number of synonym maps used | Sum | Count |
| Synonym Maps Quota | The maximum number of synonyms that can be added | Sum | Count |
| Synonym Maps Usage (FM) | The average percentage of synonyms used | Average | Percentage |
| Vector Index | |||
| Vector Index | The number of vector indexes used | Sum | Count |
| Vector Index Quota Size | The maximum number of vector indexes that can be added | Sum | Count |
| Vector Index Usage (FM) | The average percentage of vector indexes used | Average | Percentage |
| Document | |||
| Document | The number of documents used | Sum | Count |
| Document Quota | The maximum number of documents that can be added; if the service has an unlimited number of documents, there will be no data for the document quota and document percentage metrics | Sum | Count |
| Document Usage (FM) | The average percentage of documents used; if the service has an unlimited number of documents, there will be no data for the document percentage metrics | Average | Percentage |
| Limits | |||
| Maximum Fields per Index | The maximum number of fields in an index | Max | Count |
| Maximum Field Nesting Depth per Index | The maximum number of field nesting depth in an index | Max | Count |
| Maximum Complex Collection Fields per Index | The maximum number of complex collection fields in an index | Max | Count |
| Maximum Complex Objects in Collections per Document | The maximum number of complex objects in collections in a document | Max | Count |
Threshold configuration
Associating a threshold profile can be done from the monitor's Edit page:
- Under Configuration Profiles > Threshold and Availability > select the corresponding threshold profile from the drop-down.
The changes made to this threshold profile will be applied to all the associated monitors. You can either add or edit a threshold profile by clicking the + or pencil icon, respectively.
Bulk Action
Bulk association of threshold profiles can be done from the Admin page (Admin > Inventory > Bulk Action > under Monitor Configuration, go to Modify Threshold Profile).
You can set threshold values for the metrics by selecting the Threshold and Availability option. You can also configure IT automation at the attribute level.
Default thresholds
Site24x7 alerts you based on a set of default thresholds. These default thresholds ensure that your service capacity is not overutilized, thus maintaining optimal storage, performance, and reduced costs.
These are the default thresholds:
- Resource Health
- On Change Configuration
- Metrics threshold
Resource Health:
- Alert if Resource Health is Unavailable
- Alert if Resource Health is Unknown
On Change Configuration:
- Alert if Compute Size is Changed
- Alert if Replica Count is Changed
- Alert if Partition Count is Changed
- Alert if Public Network Access is Changed
Metrics threshold:
- Throttled Search Queries Percentage
- Indexes Usage Percentage
- Indexers Usage Percentage
- Data Sources Usage Percentage
- Aliases Usage Percentage
- Skillset Usage Percentage
- Storage Usage Percentage
- Synonym Maps Usage Percentage
- Vector Index Usage Percentage
- Document Usage Percentage
IT automation
Site24x7 offers a set of exclusive IT automation tools to auto-resolve performance degradation issues. These tools react to events proactively rather than waiting for manual intervention.
How to configure IT automation for a monitor
Configuration Rules
With Site24x7's Configuration Rules, you can set parameters like Threshold Profile, Notification Profile, Tags, and Monitor Group for multiple monitors. These rules can be configured and run for the existing or new monitors (during addition) matching the given criteria.
How to add a configuration rule
Reports
Gain in-depth data about the various parameters of your monitored resources and accentuate your service performance using our insightful reports.
To view reports for Azure AI Search:
- Navigate to the Reports section in the left navigation pane.
- Select Azure AI Search from the menu on the left.
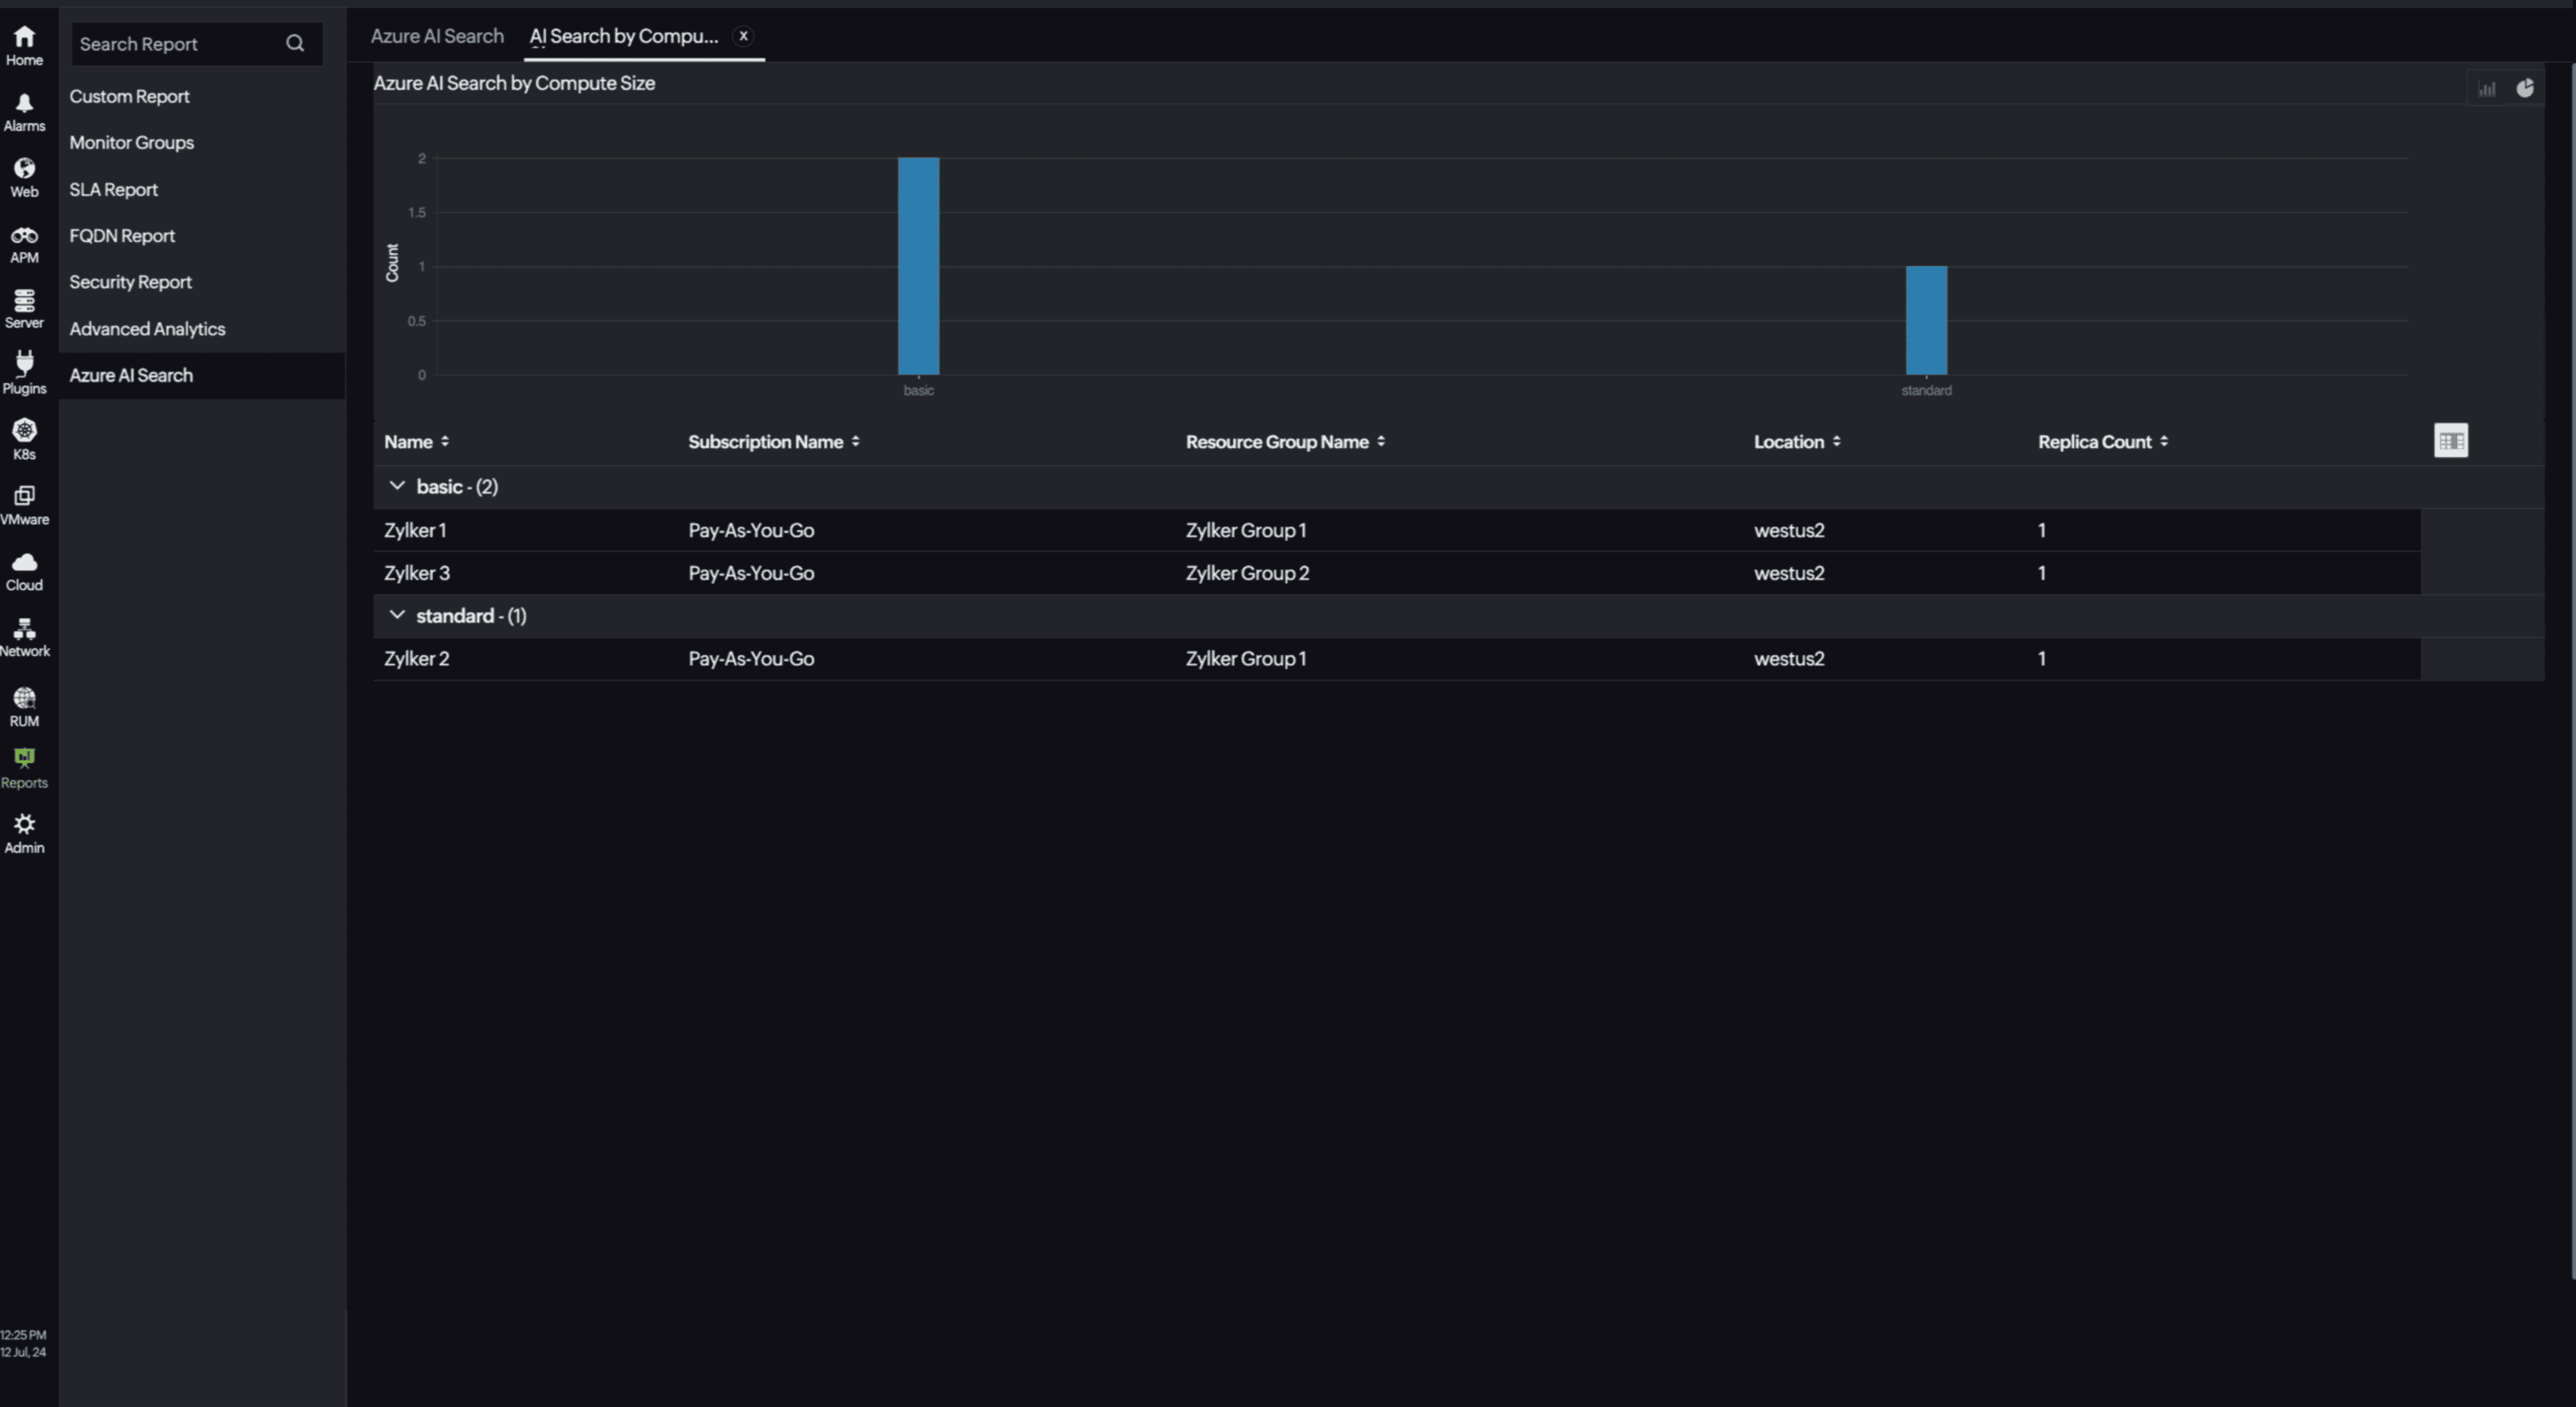
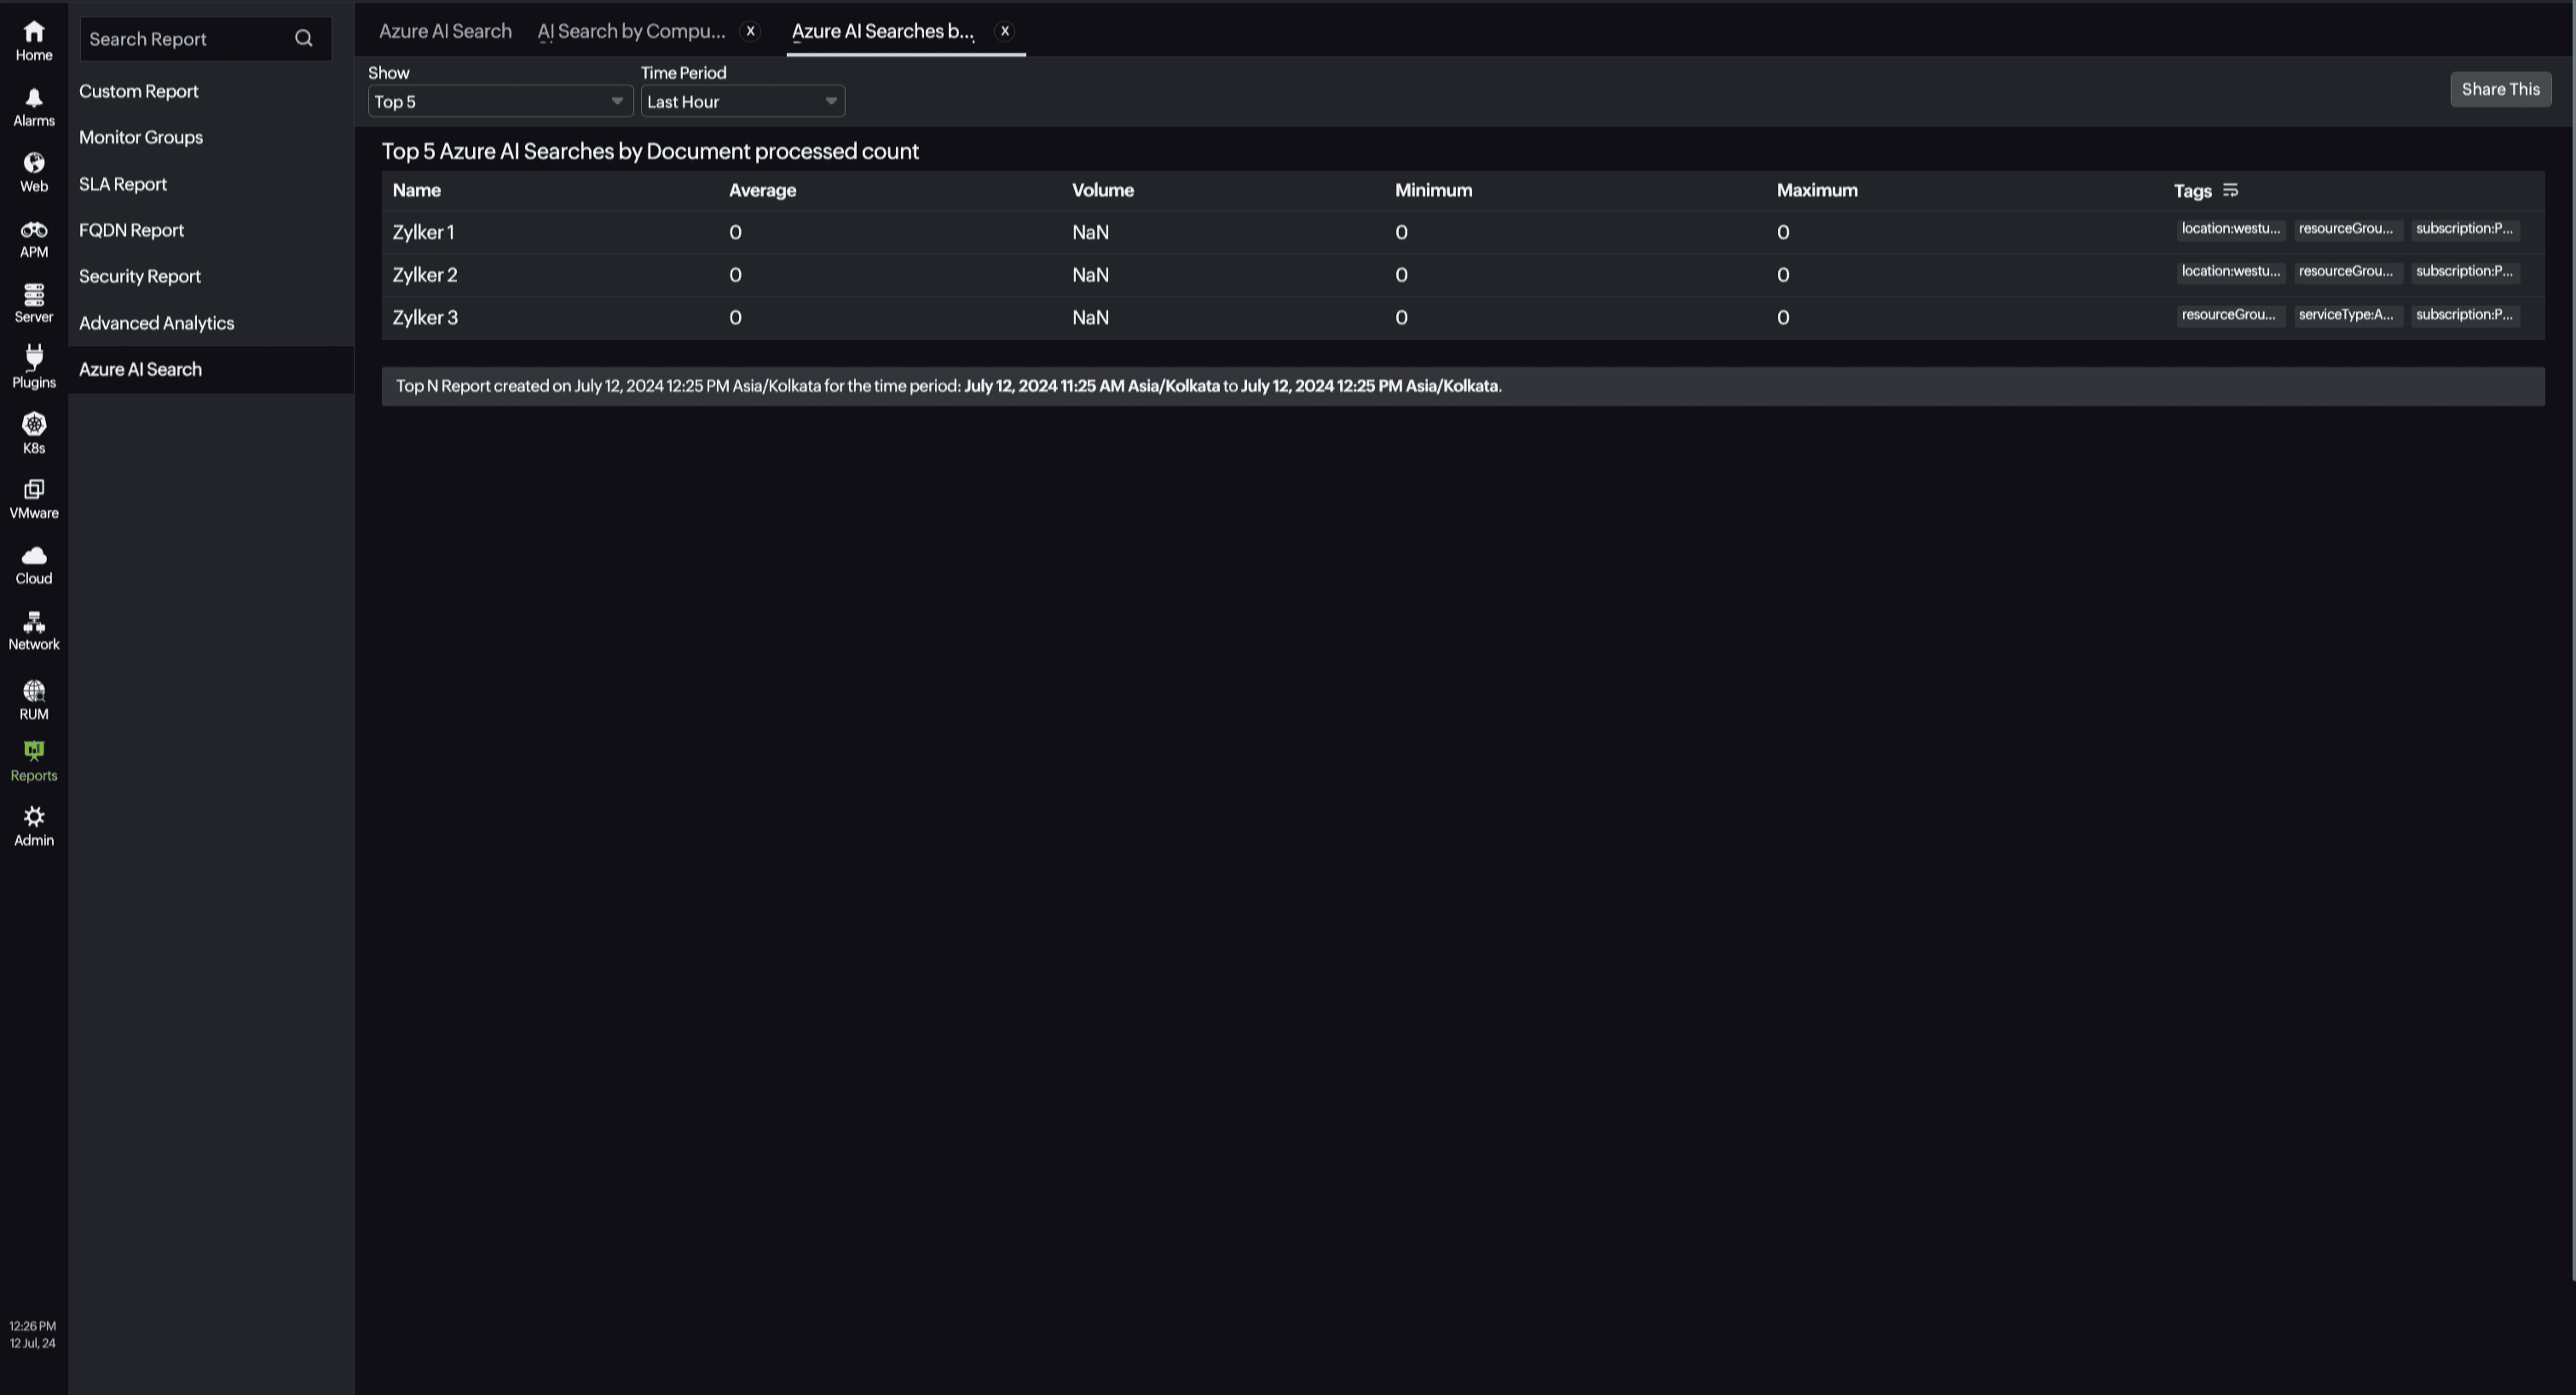
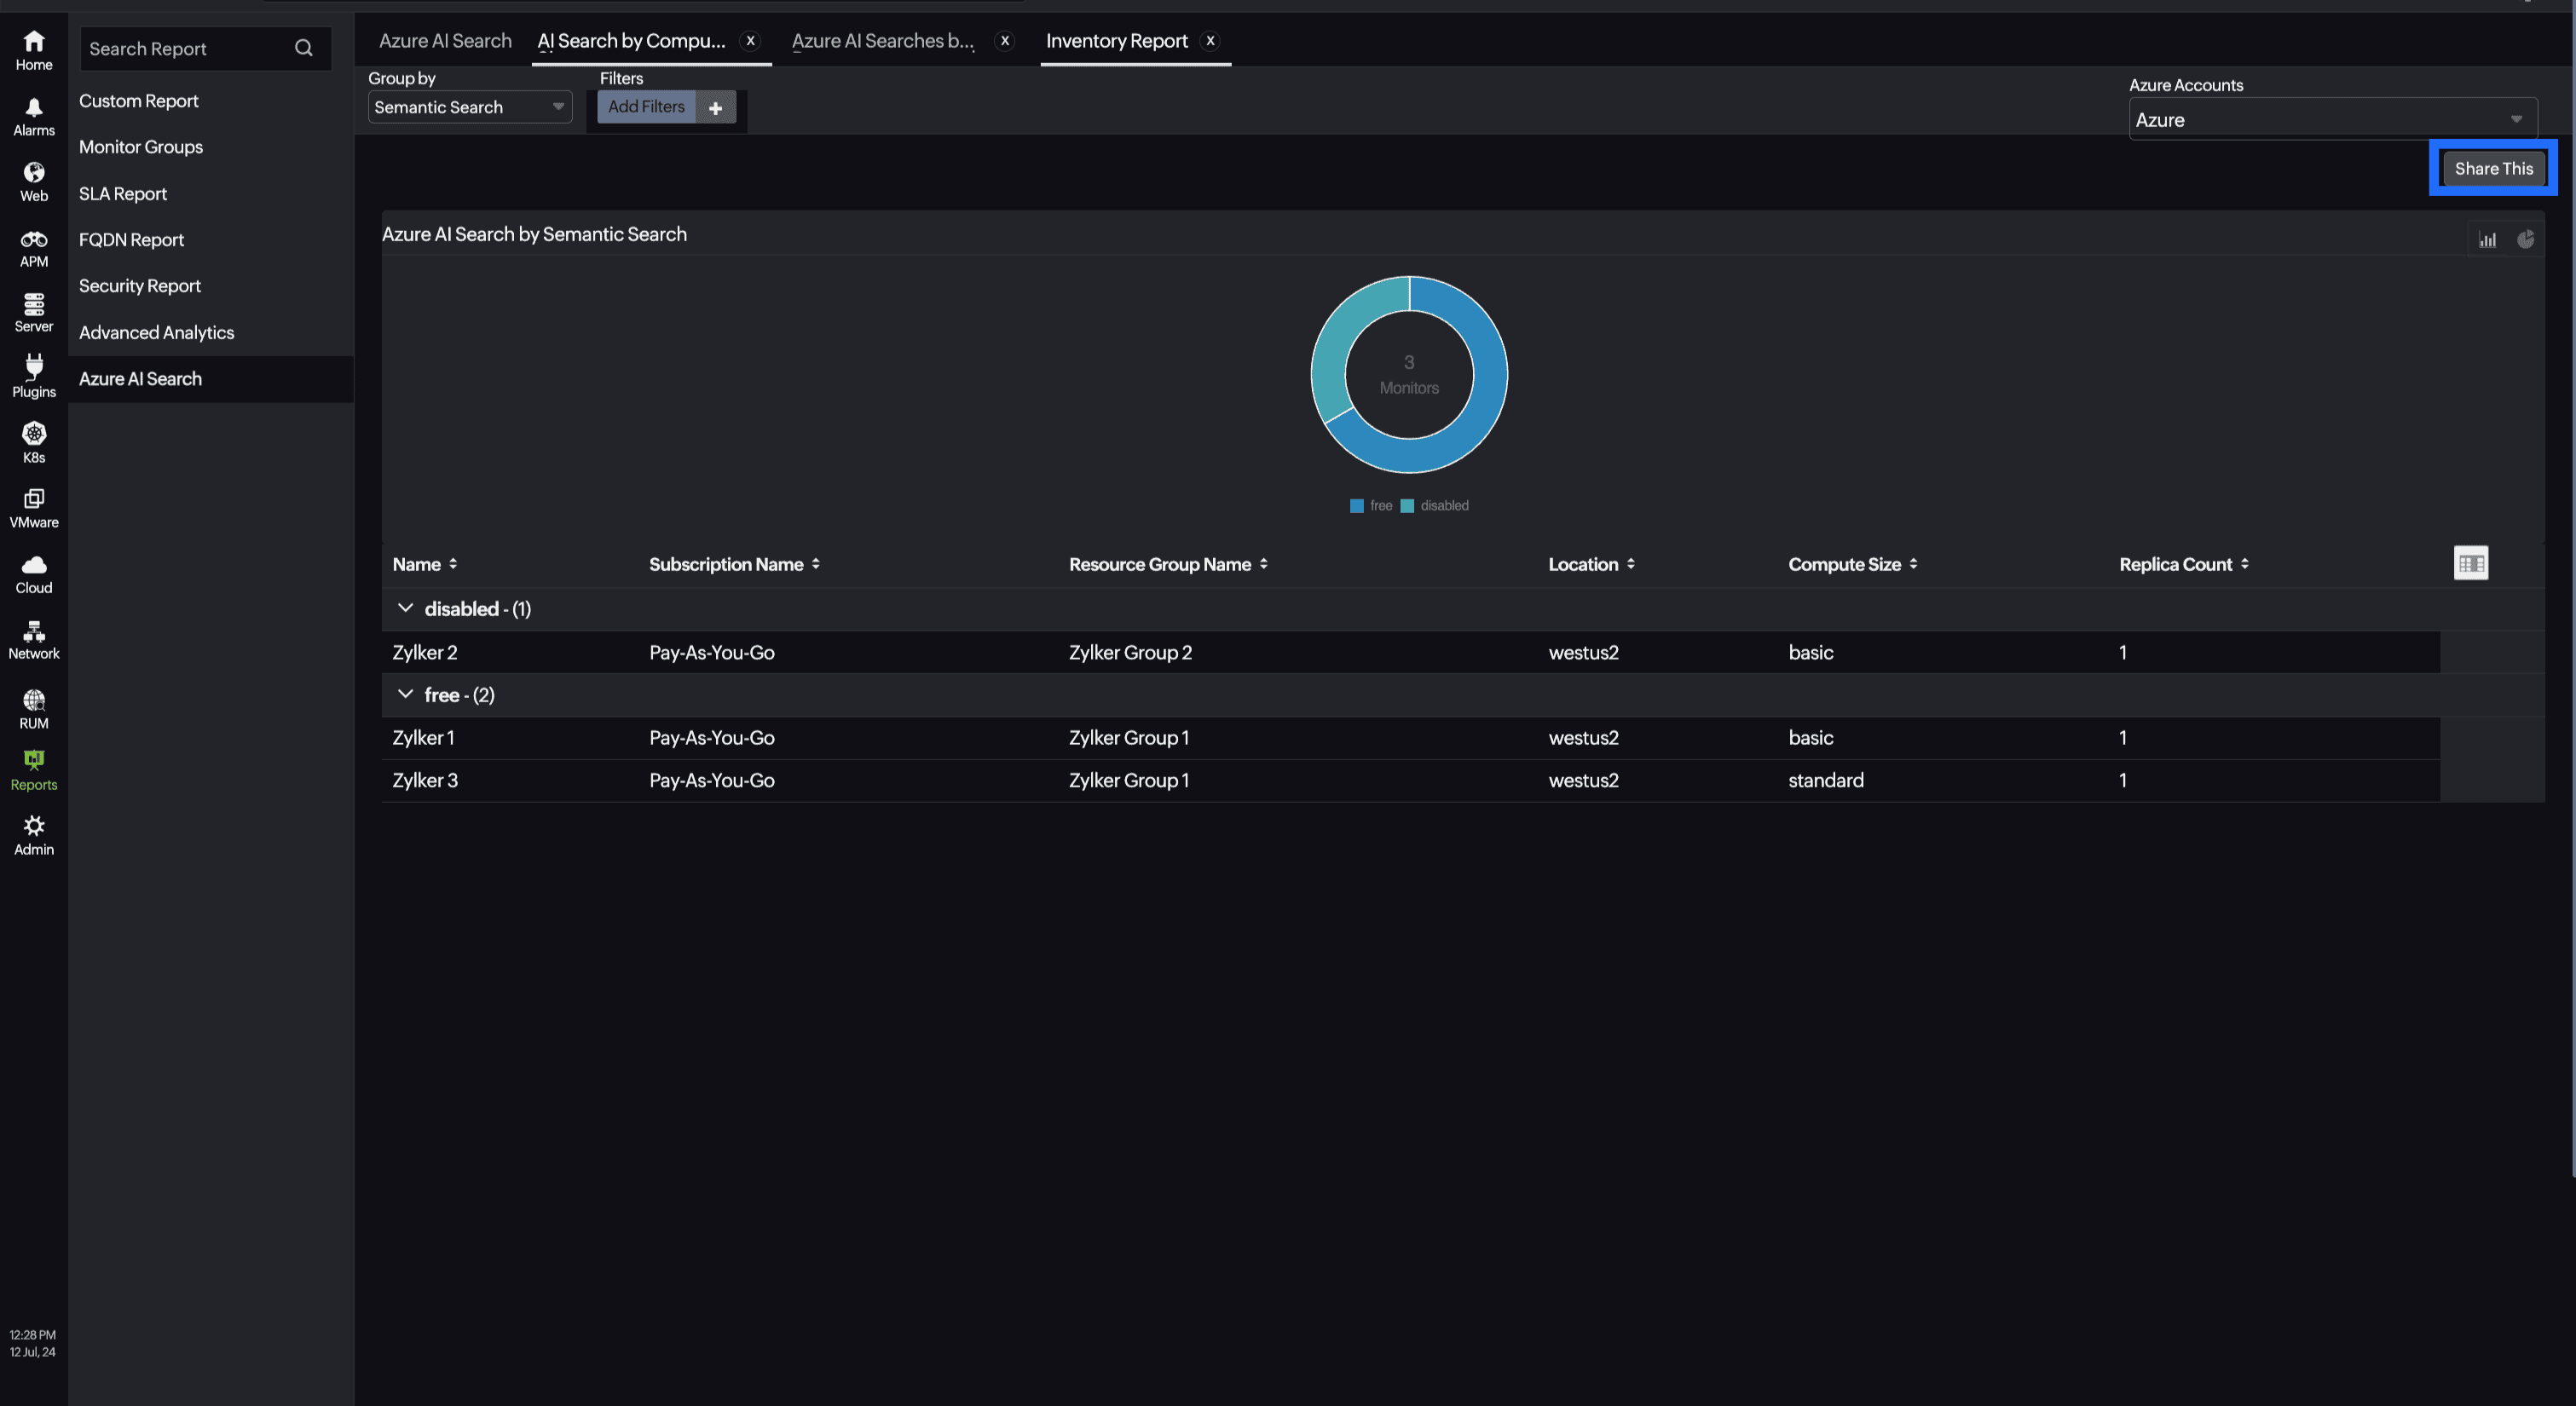
You can find the Availability Summary Report and Performance Report for one selected monitor, or you can get the Inventory Report, Summary Report, Availability Summary Report, Health Trend Report, AI Search by Compute Size Report, and Performance Report for all the monitors. Apart from this you can view the Top N and Bottom N Reports.
AI Search by Compute Size Report:
Site24x7's Azure AI Search monitoring also provides an AI Search by Compute Size report that will enable you to gain deep insights into your resources.

Top N and Bottom N reports
- Azure AI Searches by Search Latency
- Azure AI Searches by Search Queries per Second
- Azure AI Searches by Throttled Search Queries Percentage
- Azure AI Searches by Document Processed Count
- Azure AI Searches by Skill Execution Invocation Count

Scheduling a report
You can also schedule the Inventory Report by navigating to Reports > Azure AI Search > Inventory Report and clicking the Share This button at the top-right corner.
In the Schedule Report pop-up, choose the monitor, assign the desired frequency—daily, weekly, monthly, or quarterly—and receive regular reports of your inventory details to the groups that you desire.

Performance Report
You can also view the reports from the Performance tab of the Azure AI Search monitor.
- Go to the Performance tab of the Azure AI Search monitor, and get the Availability Summary Report of the monitor by clicking Availability.
- You can also find the Performance Report of the monitor by clicking any chart title.
Site24x7's Azure AI Search monitoring interface
Get an overview of the availability and usage status of Azure AI Search.
Performance
The Performance tab will help you view the data and index usage of your resource as well as the availability status of your search service. You can view metrics like Search Latency, Search Queries, Throttled Search Queries, and more.
Statistics
With the Statistics tab, you can view the quota and usage metrics of Indexes, Indexers, Aliases, Data Sources, Skillsets, Vector Indexes, and much more. Get detailed insights about the Azure AI Search service, including the number and types of objects, the maximum limits for each object type based on the service tier, the actual versus maximum storage usage, and other tier-specific limits. Monitoring these statistics is crucial for achieving optimal performance and scalability.
Configuration Details
The Configuration Details tab provides the configuration details for Azure AI Search. Details on the Partition, Replica, Compute Size, Public Network Access, and more are included in this section.
Zia Forecast
By leveraging the AI-driven Zia framework, you can examine resource consumption measurements through the forecast chart located in the Zia Forecast tab. This chart predicts upcoming performance metrics based on a seven-day historical data analysis, providing insights into the expected metric usage for the next seven days.
Outages
The Outages tab provides the history of Azure AI Search statuses, including Down, Trouble, and Critical.
Inventory
The Inventory tab provides details on licensing, threshold and availability profiles, the set notification profiles, the set user alert group, and the monitor's created time and modified time.
Log Report
The Log Report tab lists all the logs collected during every data collection along with their statuses.
Related links:
How to add an Azure monitor
How to integrate an Azure App Service monitor
How to integrate Azure Virtual Machine monitor
How to configure IT Automations for a monitor
How to add a Configuration Rule
