AWS Elastic Disaster Recovery integration
AWS Elastic Disaster Recovery (DRS) is a cost-effective, reliable disaster recovery solution that minimizes downtime, prevents data loss, and maintains up-to-date backups of your servers.
Overview
Site24x7's integration with AWS DRS offers a streamlined way to monitor and manage your disaster recovery operations. This integration provides real-time monitoring of your AWS DRS environment, tracking the health and performance of your disaster recovery setup.
It also provides you with two child monitors in addition to the Elastic Disaster Recovery monitor:
- DRS Source Server: Monitors all the source servers and provides critical insights into supported Amazon CloudWatch metrics.
- DRS Recovery Instance: Monitors the recovery instances of a particular source server and the reversed replication.
Use case
Consider that you have an Elastic Disaster Recovery monitor, which has multiple source servers as well as recovery instances of the source servers, that you want to retrieve in the event of disaster recovery.
In this scenario, if your DRS environment is integrated with Site24x7, you can gain critical insights into the DRS summary and monitor the source servers and recovery instances for each region. This integration also allows you to monitor the CloudWatch metrics so that you can take appropriate actions in time to minimize the downtime and data loss of on-premises and cloud applications.
Benefits of Site24x7's DRS integration
Integrate your DRS environment with Site24x7 to:
- Obtain a comprehensive view of your disaster recovery environment.
- Individually monitor your source servers and recovery instances for each region.
- Set thresholds for metrics and receive alerts for threshold breaches.
- Manage, optimize, and ensure the reliability of your disaster recovery processes.
Setup and configuration
- Log in to your Site24x7 account.
- Go to Cloud > AWS > Integrate AWS Account and create a cross-account IAM role to enable Site24x7 to access your AWS resources.
- On the Integrate AWS Account page, select Elastic Disaster Recovery from the Services to be discovered list.
Permissions
Ensure that Site24x7 receives the following permissions to monitor DRS:
- "drs:DescribeSourceServers"
- "drs:ListStagingAccounts"
- "drs:ListTagsForResource"
- "drs:GetReplicationConfiguration"
- "drs:GetLaunchConfiguration"
- "drs:DescribeRecoveryInstances"
Polling Frequency
Site24x7 queries AWS service-level APIs according to the set polling frequency (from once a minute to once a day) to collect metrics from an Elastic Disaster Recovery monitor.
Supported Metrics
Elastic Disaster Recovery
The supported metrics for an Elastic Disaster Recovery monitor are provided below:
| Metric name | Description | Statistics | Unit |
|---|---|---|---|
| Total Source Server Count | The total number of source servers | Maximum | Count |
| Active Source Server Count | The total number of active source servers | Maximum | Count |
DRS Source Server
The supported metrics for a DRS Source Server monitor are provided below:
| Metric name | Description | Statistics | Unit |
|---|---|---|---|
| Backlog | The amount of data yet to be synced | Average | Bytes |
| Elapsed Replication Duration | The amount of time that has passed since the last drill or recovery instance launch | Average | Seconds |
| Duration Since Last Successful Recovery Launch | The cumulative amount of time this server has been replicating | Average | Seconds |
| Replication Progress | The percentage of the server's storage that has been successfully replicated | Average | Percent |
| Lag Duration | The age of the latest consistent snapshot | Average | Seconds |
DRS Recovery Instance
The supported metrics for a DRS Recovery Instance monitor are provided below:
| Metric name | Description | Statistics | Unit |
|---|---|---|---|
| Lag Duration | The age of the latest consistent snapshot | Average | Seconds |
| Backlog | The amount of data that has been written in the launched recovery instance but has not yet been copied to the target server | Average | Bytes |
| Elapsed Replication Duration | The amount of time that has passed since the reversed replication started | Average | Seconds |
| Replication Progress | The progress of the replication of the recovery instance by the percentage completed | Average | Percent |
Threshold configuration
To configure thresholds for an Elastic Disaster Recovery monitor:
- Log in to your Site24x7 account and navigate to Admin > Configuration Profiles > Threshold and Availability.
- Click Add Threshold Profile.
- Select the applicable monitor type from the Monitor Type drop-down menu and provide an appropriate name in the Display Name field. The applicable monitor types are Elastic Disaster Recovery, DRS Source Server, and DRS Recovery Instance.
- The supported metrics are displayed in the Threshold Configuration section. You can set threshold values for all the metrics mentioned above.
- Click Save.
You can manage all the alerts to ensure that the notifications are sent through the parent monitor with the status propagation feature.
Licensing
- Elastic Disaster Recovery: Each Elastic Disaster Recovery monitor utilizes one basic monitor license.
- DRS Source Server: Each DRS Source Server monitor utilizes one basic monitor license.
- DRS Recovery Instance: Each DRS Recovery Instance monitor utilizes one basic monitor license.
Viewing DRS data
To monitor your DRS environment, log in to your Site24x7 account and navigate to Cloud > AWS > Elastic Disaster Recovery.
Monitor data
The monitor data for each Elastic Disaster Recovery monitor and the child monitors is given below.
Elastic Disaster Recovery
You can view your Elastic Disaster Recovery monitor data on the following tabs.
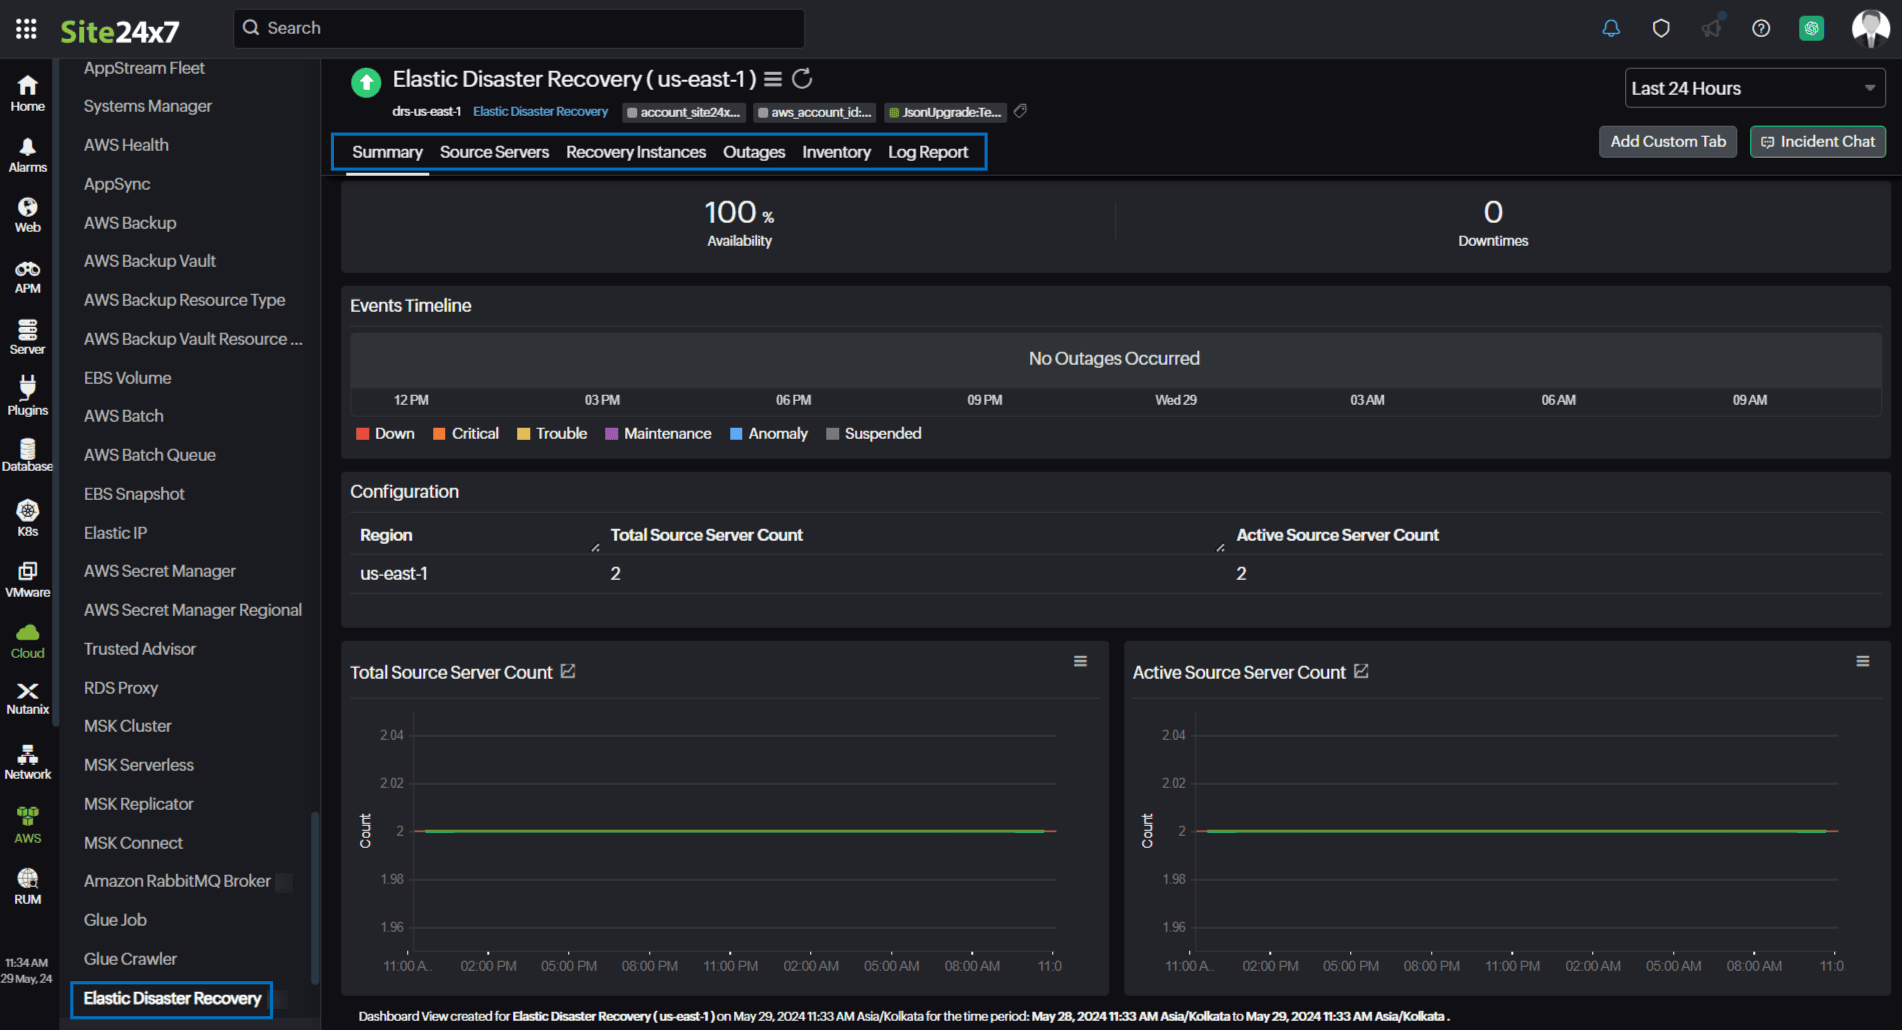
Summary
The Summary tab provides an overview of the Events Timeline and metrics in the form of charts. You can also view details such as the Region, Total Source Server Count, and Active Source Server Count in the Configuration section.
Source Servers
View the Source Servers Availability and the DRS Source Server monitors along with their Name, Lag Duration, and Backlog on this tab. Click Threshold Configuration to configure thresholds for the DRS Source Server monitors.
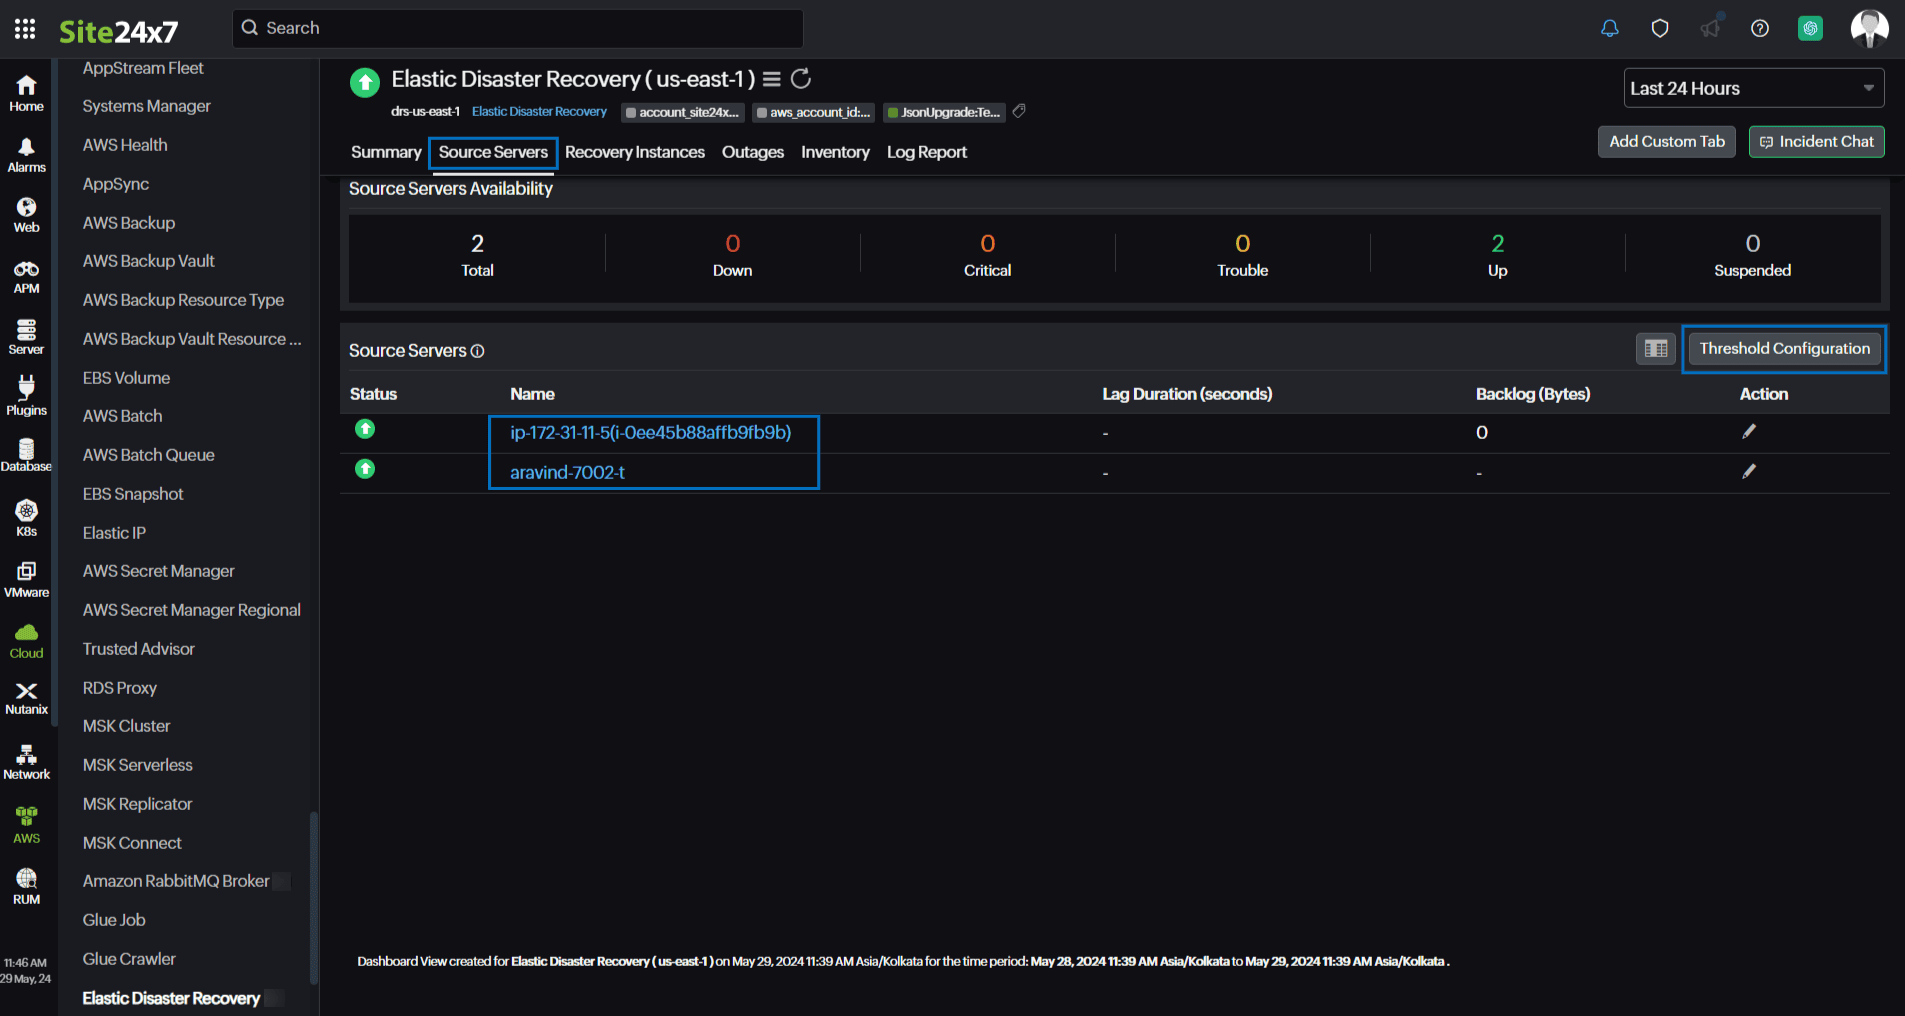
Click a monitor name to view the DRS Source Server monitor details.
Recovery Instances
The Recovery Instances tab displays the Recovery Instances Availability and the DRS Recovery Instance monitors along with their Name, Lag Duration, and Backlog. Click Threshold Configuration to configure thresholds for the DRS Recovery Instance monitors.
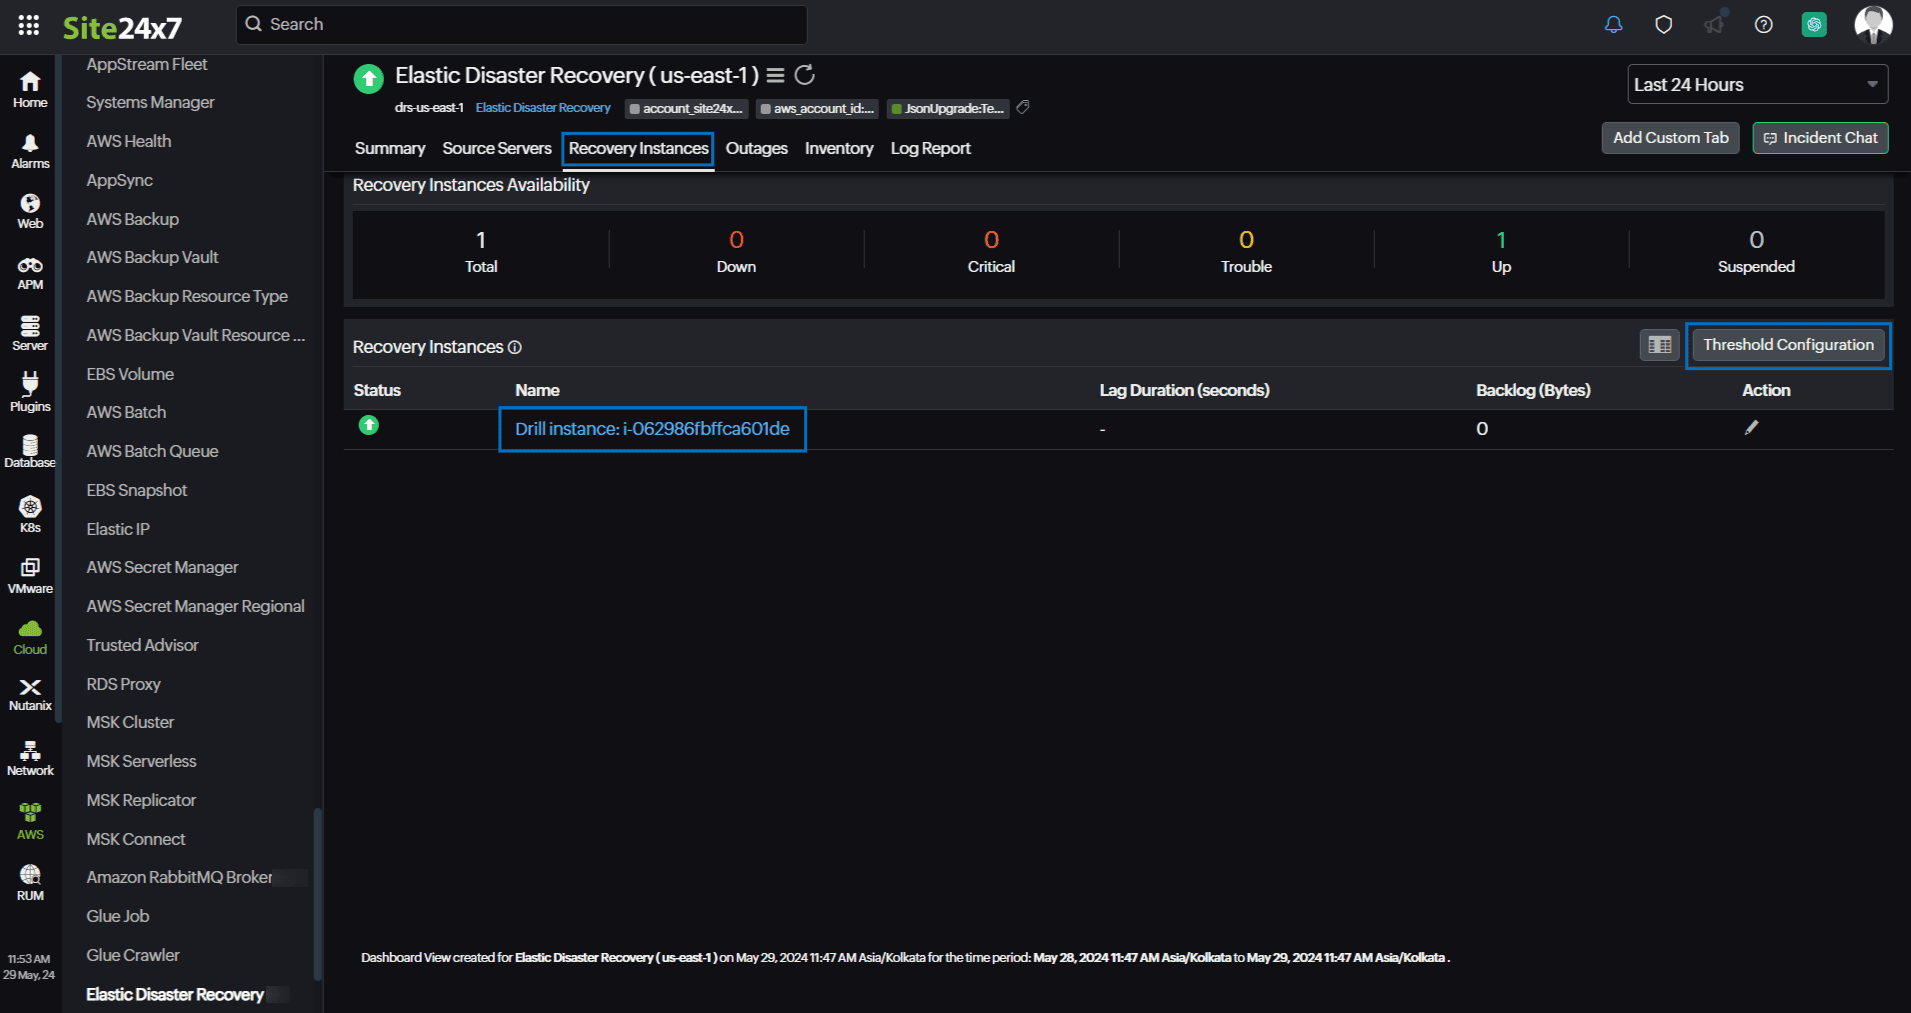
Click a monitor name to view the DRS Recovery Instance monitor details.
Outages
The Outages tab provides details on an outage's start time, end time, duration, and comments (if any).
Inventory
Obtain details like the Resource Name, Region, and Monitor Licensing Category on the Inventory tab. The Threshold and Availability Profile and the Notification Profile can be set according to the user and viewed on this tab.
Log Report
This tab offers a consolidated report of each Elastic Disaster Recovery monitor's log status, which can be downloaded as a CSV file.
DRS Source Server
You can view your DRS Source Server monitor data on the following tabs.
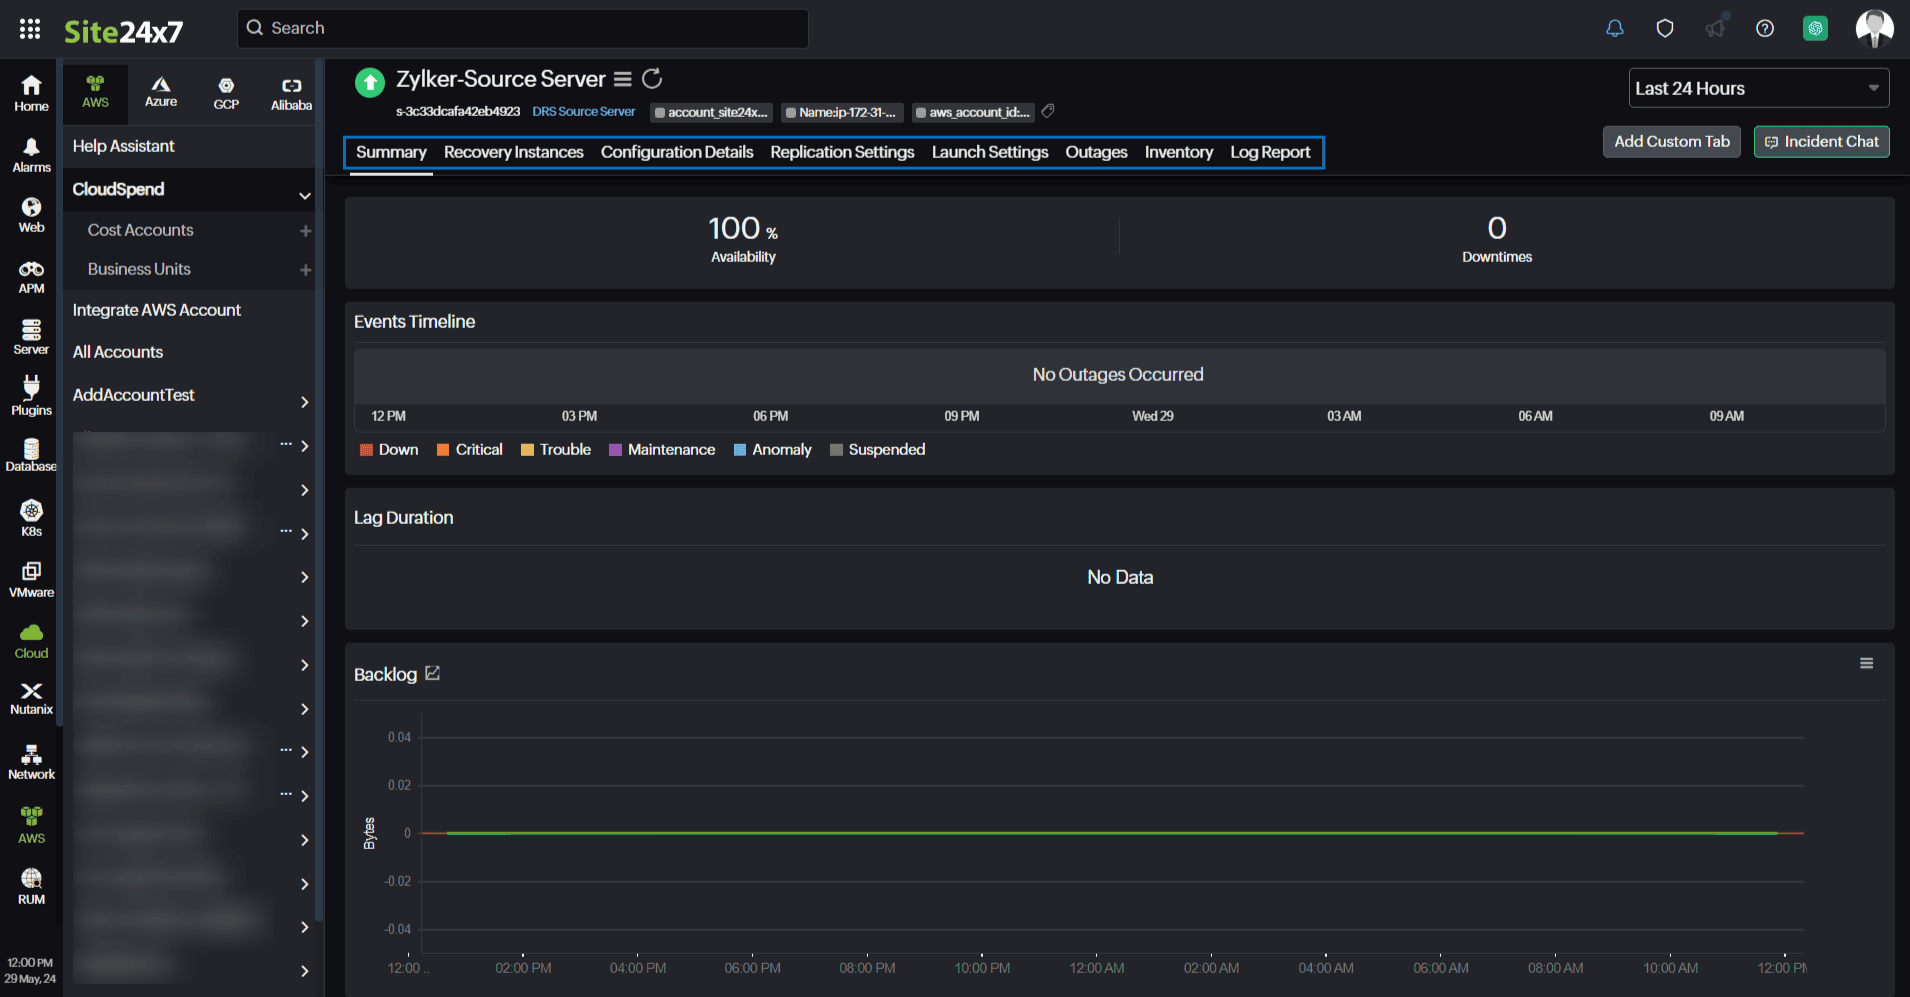
Summary
The Summary tab provides an overview of the Events Timeline, Lag Duration, and metrics in the form of charts.
Recovery Instances
The Recovery Instances tab displays the Recovery Instances Availability and the DRS Recovery Instance monitors along with their Name, Lag Duration, and Backlog. Click Threshold Configuration to configure thresholds for the DRS Recovery Instance monitors. To view the DRS Recovery Instance monitor details, click a monitor name.
Configuration Details
View the configuration details of the DRS Source Server monitors, such as the Region, AWS Source Server ID, Agent version, and AWS instance ID, on this tab.
Replication Settings
The Replication Settings tab displays the replication settings of the DRS Source Server monitors, such as the Region, AWS Source Server ID, Subnet, and Replication Server Instance Type.
Launch Settings
The Launch Settings tab provides the launch settings details of the DRS Source Server monitors, such as the Region, AWS Source Server ID, and Instance type right sizing information.
Outages
The Outages tab provides details on an outage's start time, end time, duration, and comments (if any).
Inventory
Obtain details like the Resource Name, Region, and Monitor Licensing Category on the Inventory tab. The Threshold and Availability Profile and the Notification Profile can be set according to the user and viewed on this tab.
Log Report
This tab offers a consolidated report of each DRS Source Server monitor's log status, which can be downloaded as a CSV file.
DRS Recovery Instance
You can view your DRS Recovery Instance monitor data on the following tabs.
Summary
The Summary tab provides an overview of the Events Timeline, Lag Duration, and metrics in the form of charts.
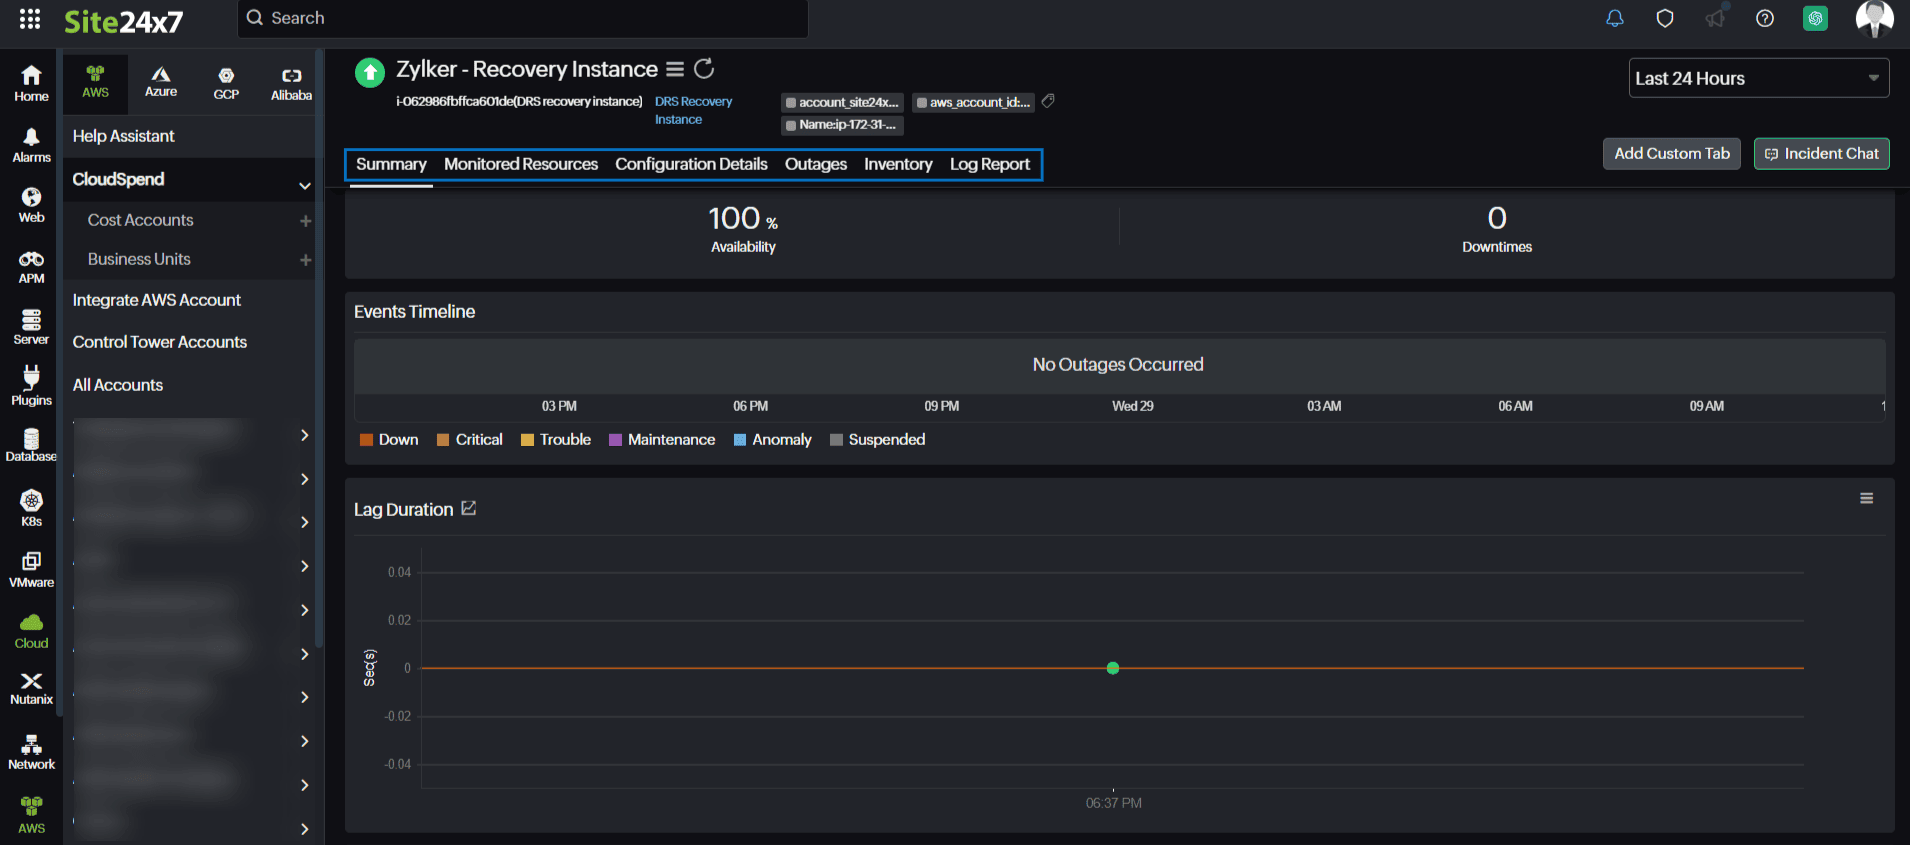
Monitored Resources
The Monitored Resources tab lists all the resources that are managed and monitored by Site24x7.
Configuration Details
View the configuration details of the DRS Recovery Instance monitors, such as the Region, AWS Recovery Instance ID, Recovery Instance ARN, and Agent Version, on this tab.
Outages
The Outages tab provides details on an outage's start time, end time, duration, and comments (if any).
Inventory
Obtain details like the Resource Name, Region, and Monitor Licensing Category on the Inventory tab. The Threshold and Availability Profile and the Notification Profile can be set according to the user and viewed on this tab.
Log Report
This tab offers a consolidated report of each DRS Recovery Instance monitor's log status, which can be downloaded as a CSV file.