Threshold and Availability for Real User Monitoring
After adding an application monitor to your Site24x7 real user monitor, you can create a threshold and availability profile for the alarm engine to send alerts when the resource is critical or in trouble. The alert occurs on any breach of predefined conditions that you can set.
Add a threshold and availability profile
Follow the steps given below to add a threshold and availability profile to the real user monitor:
- Log in to the Site24x7 web client.
- Click Admin > Configuration Profiles > Threshold and Availability.
- Select Threshold Profile from the Add Threshold Profile drop-down menu in the top-right corner of the Threshold and Availability screen to launch the Add Threshold Profile screen.
- Choose Real User Monitor as the Monitor Type.
- Provide a Display Name for identification purposes.
- Configure the thresholds. Learn more.
- Click Save.
Threshold profiles can also be added by following the steps below.
- Navigate to RUM > your application.
- Click the hamburger icon (
 ) and choose Edit to launch the Edit Monitor Details screen.
 - Click the add symbol in the Threshold and Availability field to launch the Add Threshold Profile screen.
Please note that the monitor type will be Real User Monitor by default.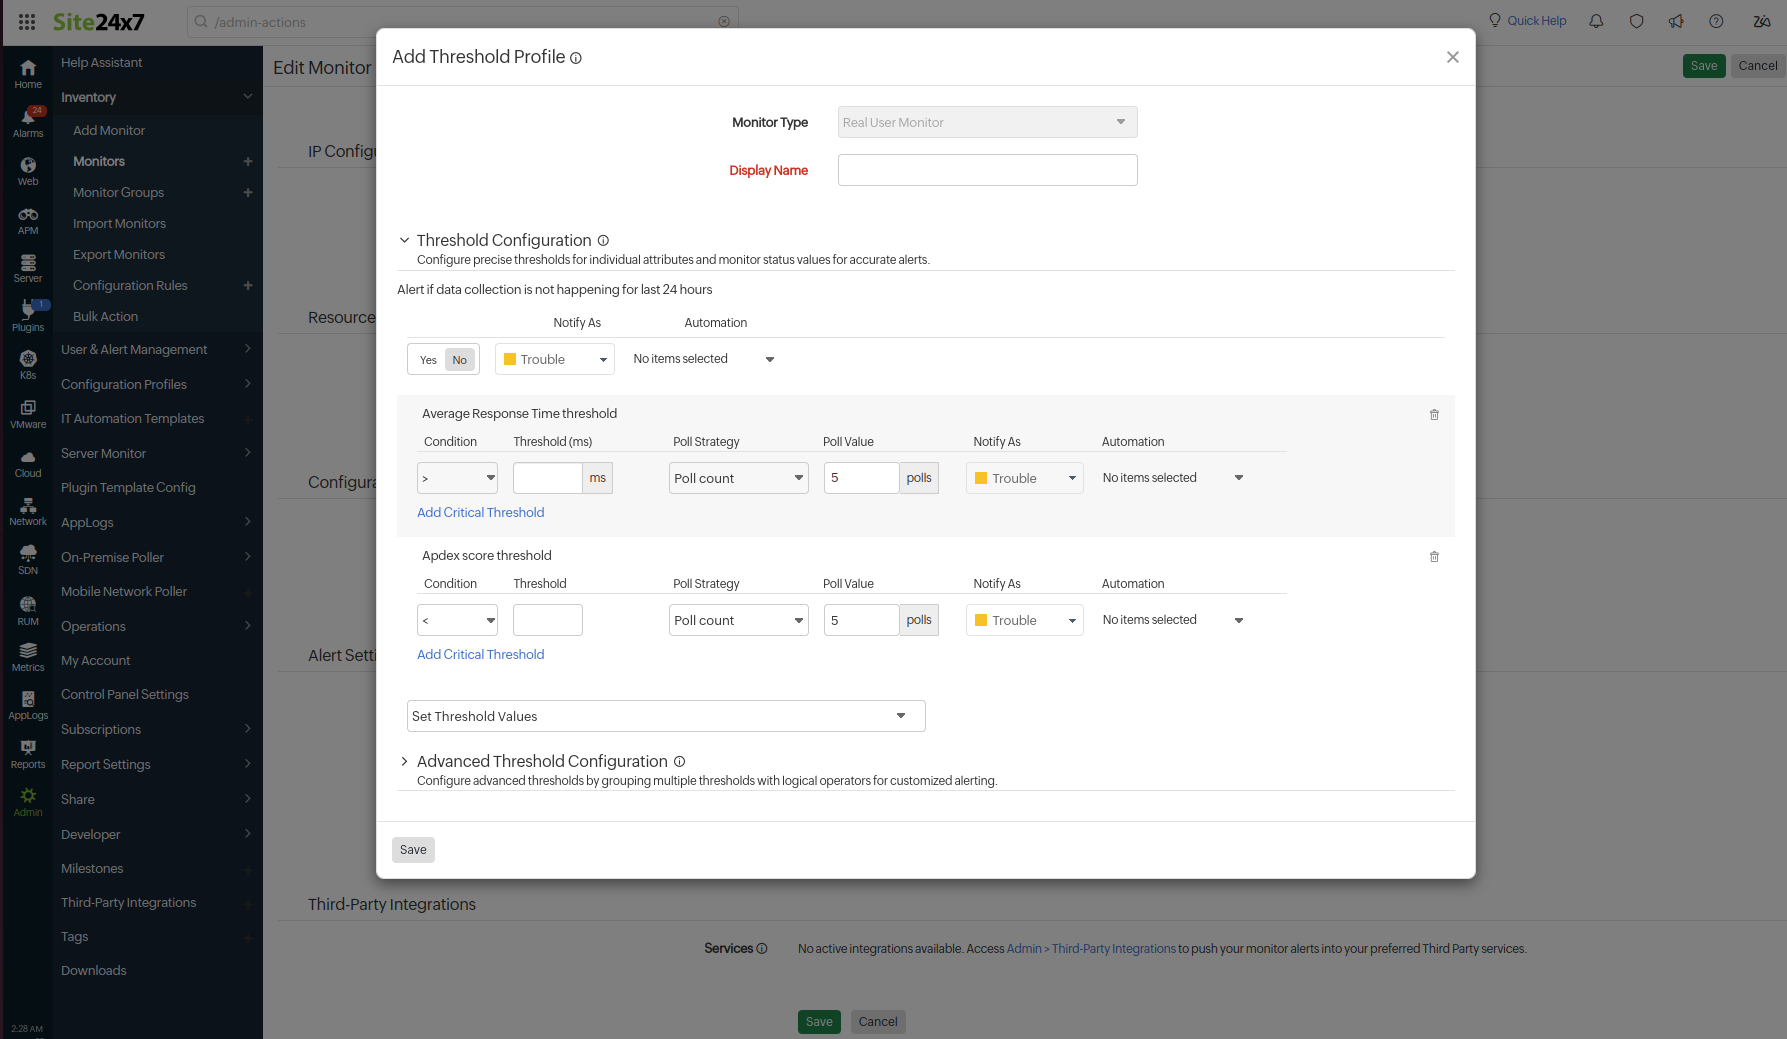
- Configure the thresholds. Learn more.
- Click Save.
Alert if data collection is not happening for the last 24 hours
Enable this option to receive alerts when the monitor has not collected any data for the past 24 hours.
Yes/No toggle: Set this to Yes to activate the alert.
Notify As: Choose how you want the monitor status to reflect this issue (Trouble or Critical).
This status will be retained until the RUM monitor starts populating data again.
Threshold configuration
You can select the required parameters from the Set Threshold Values drop-down menu at the bottom of the screen.
Select any condition from the Condition drop-down menu, such as >, <, >=, <=, and =, and then enter a value in the Threshold box. The threshold breach will be validated based on the selected condition.
Average Response Time threshold:
When the average response time breaches the configured threshold value, you will be notified with a Trouble or Critical status. You can set up trouble or critical alerts for average response time values that exceed the configured threshold.
The average response time is set to 2,000ms by default.
Apdex score threshold:
Apdex score values range from zero to one, with one indicating maximum user satisfaction and zero indicating frustrated satisfaction levels. You can set up trouble or critical alerts for Apdex score values that fall below the configured threshold.
Error count threshold:
When the error count breaches the configured threshold value, you will be notified with a Trouble or Critical status.
For example, you can configure your application to receive alerts when the error count exceeds 50 or whatever value you deem appropriate for your application.
Throughput of application cpm:
When the application's throughput (in counts per minute, or CPM) breaches the configured threshold value, you will be notified with a Trouble or Critical status.
Request count of application:
When the application's request count breaches the configured threshold value, you will be notified with a Trouble or Critical status.
Sessions count threshold:
When the number of user sessions breaches the configured threshold value, you will be notified. You can set up trouble or critical alerts for session counts that exceed the configured threshold.
Average Front end time Threshold:
When the average front-end time breaches the configured threshold value, you will be notified with a Trouble or Critical status.
Average Network end time Threshold:
When the average network end time breaches the configured threshold value, you will be notified with a Trouble or Critical status.
Average Back end time Threshold:
When the average back-end time breaches the configured threshold value, you will be notified with a Trouble or Critical status.
Web Vitals:
For the below-given Web Vitals metrics, when the score breaches the configured threshold value, you will be notified with a Trouble or Critical status.
- First Input Delay
- First Contentful Paint
- Largest Contentful Paint
- Cumulative Layout Shift
- Interaction to Next paint
Refer to this document to learn more about the threshold categorization of Web Vitals values.
Validating a threshold breach
The poll count is the default strategy for validating a threshold breach. You can select the required poll strategy from the drop-down.
Poll Strategy
You can choose any strategy from the Poll Strategy drop-down. When the condition applied to any of the below threshold strategies holds true, the particular monitor's status changes to Trouble or Critical.
Poll count:
When the condition applied to the threshold value is continuously breached for the number of times specified in the poll count, the status of the monitor changes to Trouble or Critical.
A single poll count represents one minute.
Poll average:
When the average of the breached values (for the number of specified polls) satisfies the condition applied to the threshold value, the monitor's status changes to Trouble or Critical.
Time duration:
When the condition applied to the threshold value is continuously breached for the time duration specified, the status of the monitor changes to Trouble or Critical.
Average time:
When the average value of the captured values (for the configured time in the time duration) satisfies the condition applied to the threshold value, the status of the monitor changes to Trouble or Critical.
Poll Sum:
When the sum of the breached values (for the number of specified polls) satisfies the condition applied to the threshold value, the status of the monitor changes to Trouble or Critical.
Time Sum:
When the sum of the captured values (for the configured time in the time duration) satisfies the condition applied to the threshold value, the status of the monitor changes to Trouble or Critical.
Min Poll:
When the minimum value of the breached values (for the number of specified polls) satisfies the condition applied to the threshold value, the status of the monitor changes to Trouble or Critical.
Min Time:
When the minimum value of the captured values (for the configured time in the time duration) satisfies the condition applied to the threshold value, the status of the monitor changes to Trouble or Critical.
Max Poll:
When the maximum value of the breached values (for the number of specified polls) satisfies the condition applied to the threshold value, the status of the monitor changes to Trouble or Critical.
Max Time:
When the maximum value of the captured values (for the configured time in the time duration) satisfies the condition applied to the threshold value, the status of the monitor changes to Trouble or Critical.
95th percentile Poll:
When the 95th percentile value of the breached values (for the number of specified polls) satisfies the condition applied to the threshold value, the status of the monitor changes to Trouble or Critical.
95th percentile Time:
When the 95th percentile value of the captured values (for the configured time in the time duration) satisfies the condition applied to the threshold value, the status of the monitor changes to Trouble or Critical.
Click the Add Critical Threshold option to add a new record for the Critical status.
Edit a threshold and availability profile
- Go to Admin > Configuration Profiles > Threshold and Availability.
- Click the profile to launch the Edit Threshold Profile screen.
- Change the parameters you want.
- Click Save.
You can also edit a particular application's threshold profile by following the steps below.
- Navigate to RUM > your application.
- Click the hamburger icon () and choose Edit to launch the Edit Monitor Details screen.
- Click the edit symbol in the Threshold and Availability field to change the parameters you want.
Please note that the monitor type will be Real User Monitor by default.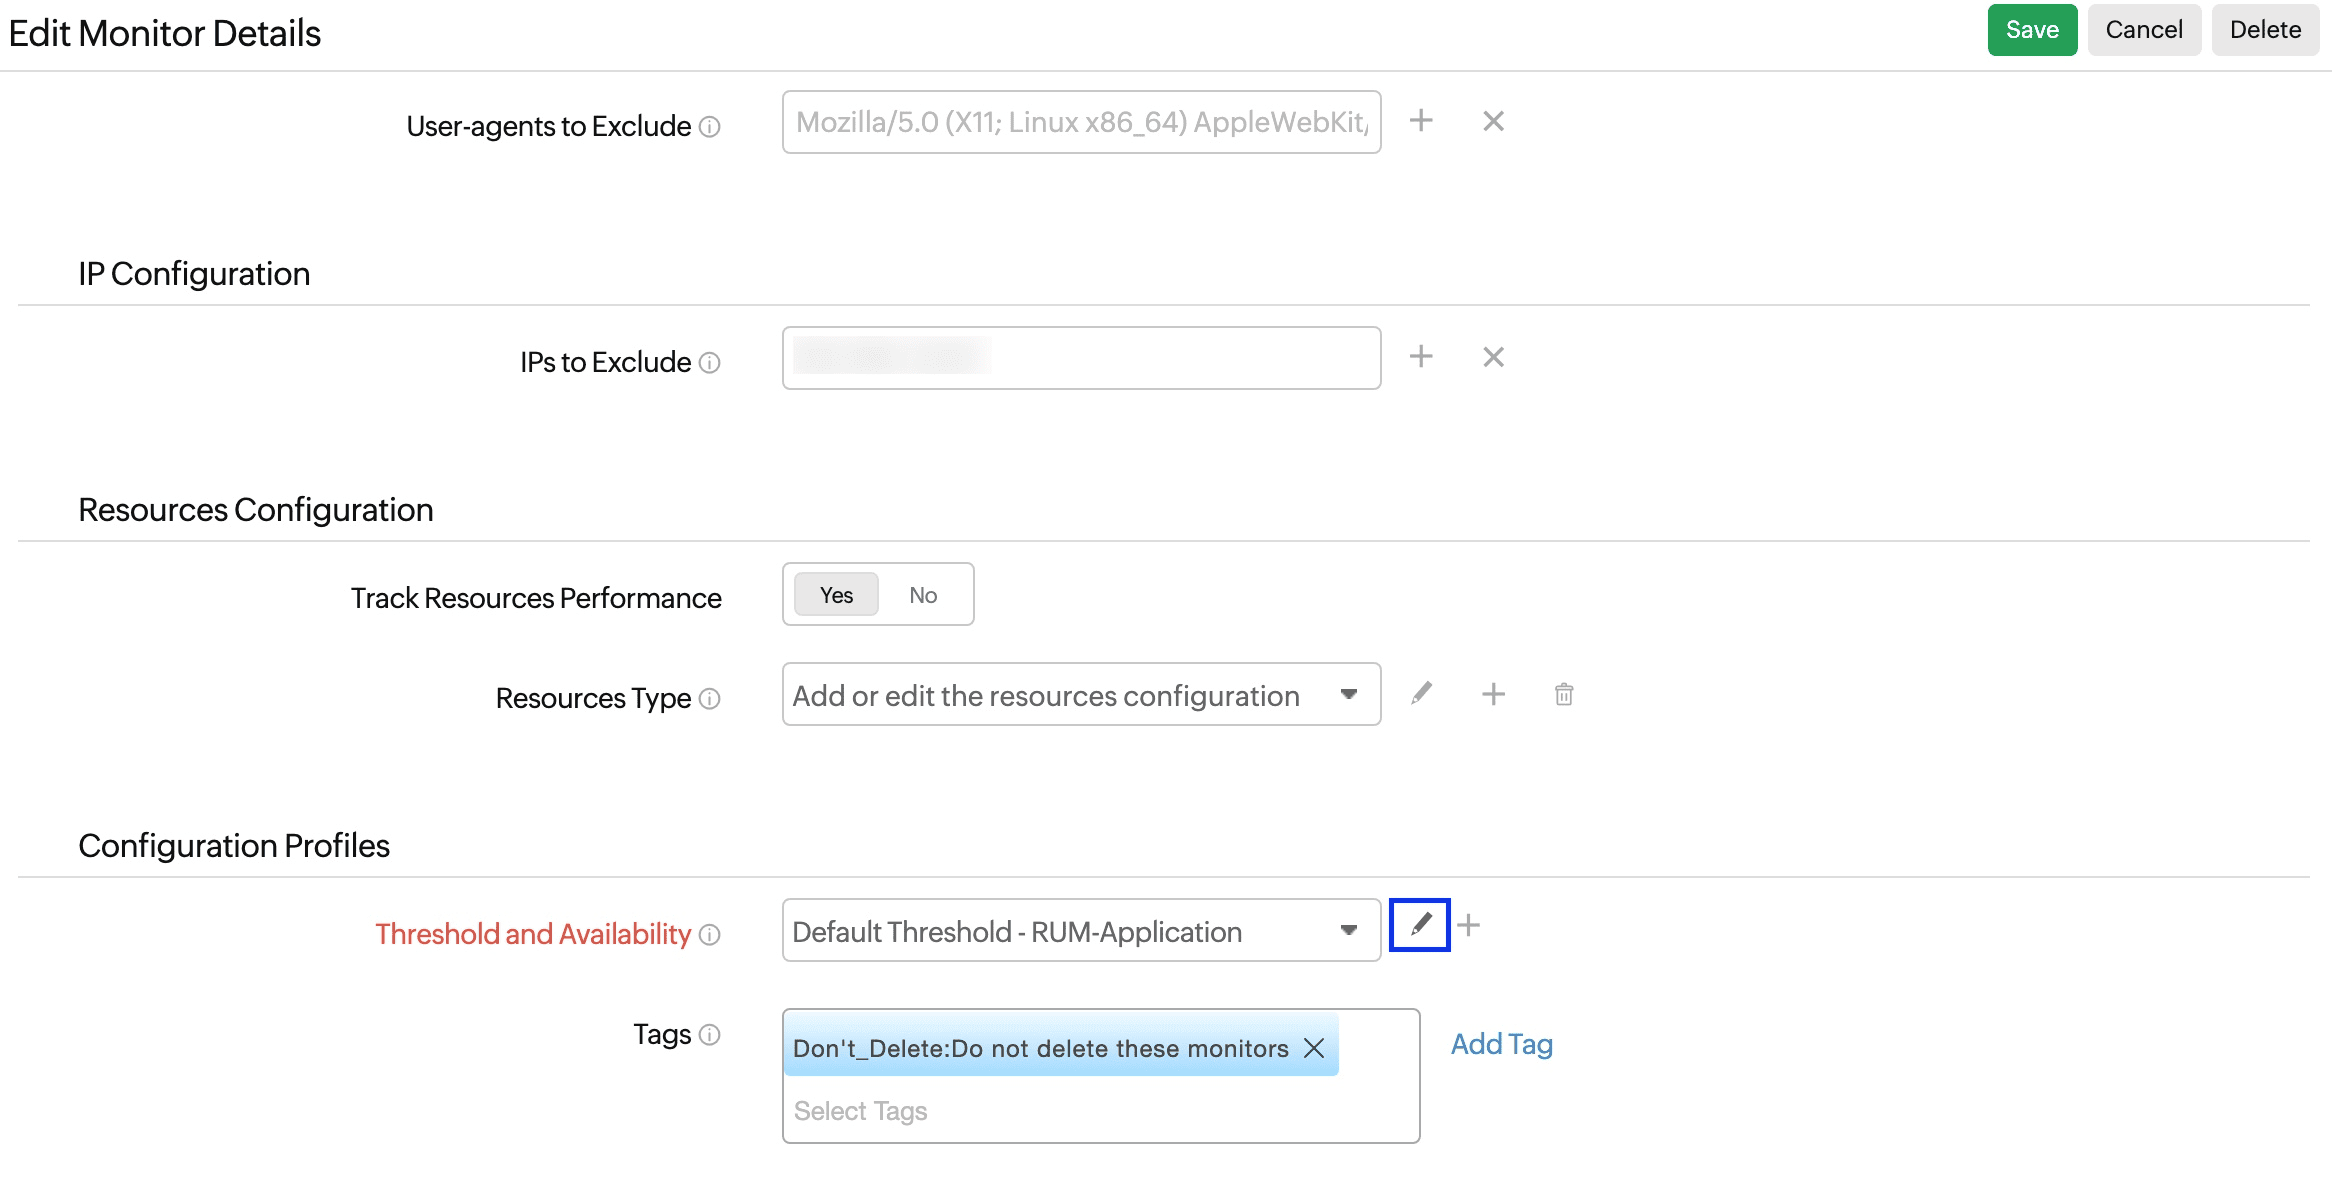
- Click Save.
Delete a threshold and availability profile
- Go to Admin > Configuration Profiles > Threshold and Availability.
- Click the hamburger icon () of the profile that you wish to delete.
- Click Delete.
Once the threshold and availability profile has been added or edited, click Save to go back to the Add Real User Monitor or Edit Monitor Details page.