Session Replay
Session Replay allows you to play back user interactions on your web application, helping you understand user journeys. It is useful for troubleshooting and enhancing the end-user experience by capturing user actions, DOM events, console events, resource insights, issues, and memory usage trends.
Video
Configuring Session Replay
To record all user sessions of your application, you need to enable this feature in the RUM script.
Add the following custom API to the RUM script to activate Session Replay and track user interactions.
s247r('recordSession',{
  "trackEvents": true,
  "trackConsoleEvents": true,
  "maskAllInput": true,
  "maskAllText": true,
  "collectNetworkDetails": true,
  "allowedNetworkUrls": [/.*/]
});
Configurations for the recordSession custom API
| Configuration | Description | Default value |
|---|---|---|
| trackEvents | Enables capturing user action events. It must be set to true to capture user events in Session Replay. | false |
| trackConsoleEvents | Enables capturing console events. | false |
| maskAllInput | Masks all input data from being captured. | true |
| maskAllText | Masks all text from being captured. | true |
| collectNetworkDetails | Enables capturing network event details. | false |
| allowedNetworkUrls | A regex or list of regex patterns to configure which network URLs should be captured (e.g., [ /.*/ ]). | N/A |
| allowedRequestHeaders | A list of request headers that need to be captured (e.g., [ 'Custom-header', 'Accept-language' ]). | N/A |
| allowedResponseHeaders | A list of response headers that need to be captured (e.g., [ 'Custom-header' ]). | N/A |
Default included headers: ['Content-Type','Content-Length','Accept']
Permanently excluded headers: ['authorization', 'x-forwarded-for', 'cookie', 'set-cookie', 'x-api-key', 'x-real-ip', 'remote-addr', 'forwarded', 'proxy-authorization', 'x-csrf-token', 'x-csrftoken', 'x-xsrf-token']
Steps to view recorded sessions
- Log in to your Site24x7 client.
- Navigate to RUM and select the application for which you want to view session replays.
- Click Session Replay.
The recorded sessions will be displayed along with the key metrics.
| Metric | Description |
|---|---|
| Start Time | The timestamp when the session started. |
| User Name | The name of the user. |
| IP Address | The IP address of the user session. |
| Browser | The browser used by the user. |
| Device | The type of device (e.g., Windows, Linux, or Mobile). |
| Page Loads | The total number of pages loaded during the session. |
| Errors | The count of errors encountered in the session. |
| Ajax Calls | The number of AJAX requests made during the session. |
| Viewing Time | The total duration the user spent in the session. |
- Click a session to view detailed metrics.
Session details in Session Replay
This screen provides an in-depth breakdown of user interactions, errors, and performance metrics, helping you analyze the user journey and troubleshoot issues effectively.
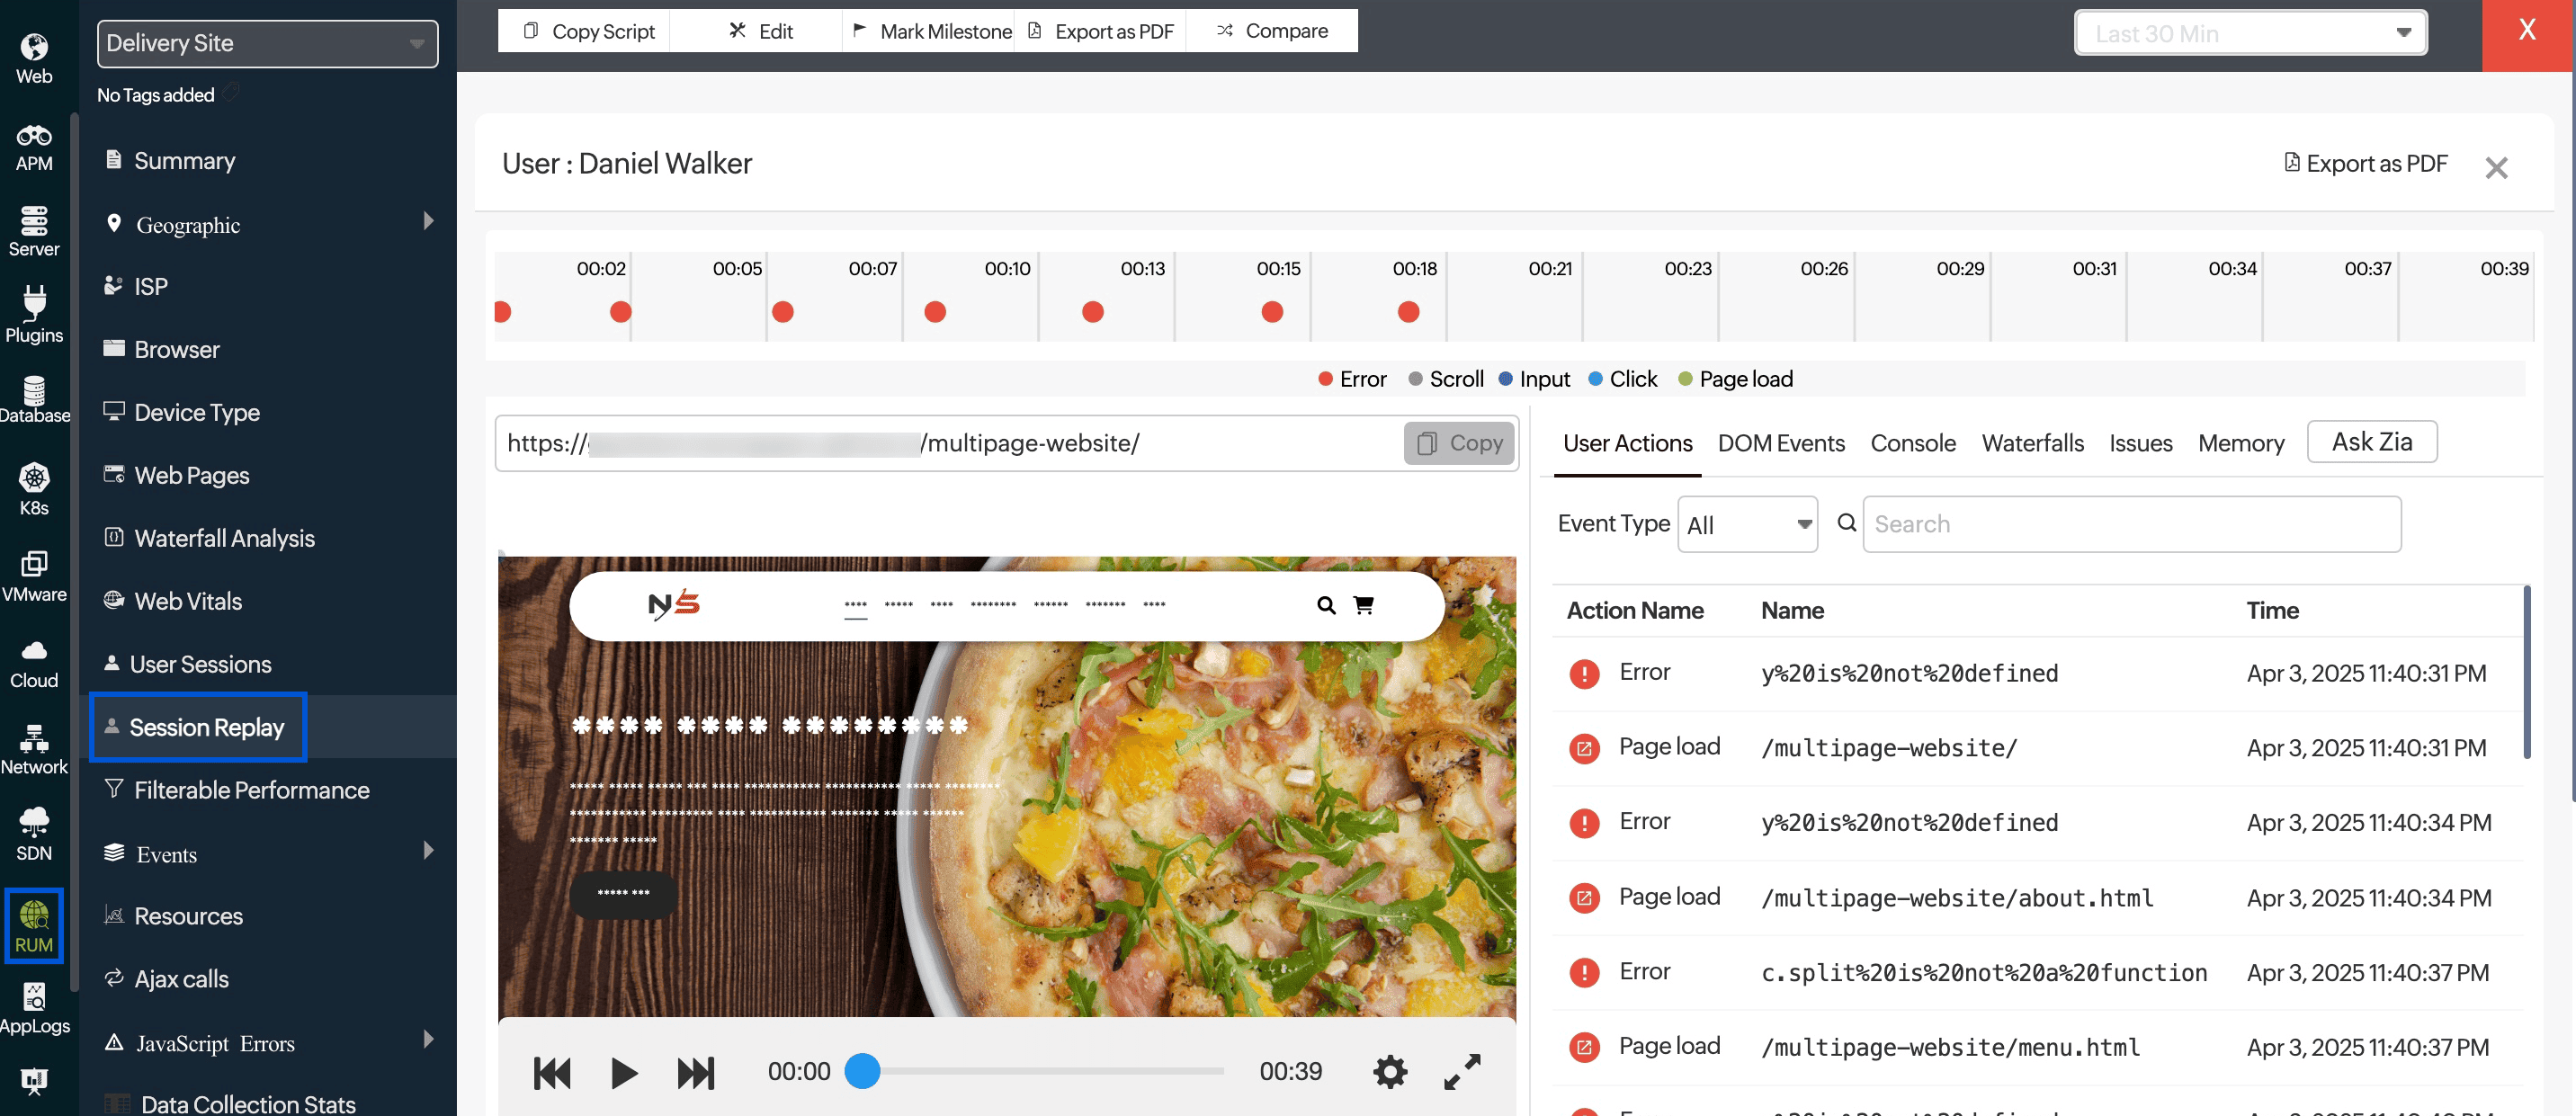
Recording
The recording timeline provides a visual representation of the session, segmented into intervals, with different event markers to help you analyze user interactions efficiently. Each event type is color-coded for quick identification:
- Red dots: Indicate errors encountered during the session.
- Grey dots: Represent scroll events.
- Dark blue dots: Show user input interactions (such as typing in a form field).
- Light blue dots: Indicate click events.
- Green dots: Represent page load events.
This color-coding helps in quickly identifying the type and frequency of events during the session.
Visited URL
You can view the exact webpage the user was interacting with during their session. The copy button allows you to quickly copy the URL for further debugging or analysis.
Replay video
The replay video feature allows you to watch a recording of a user's session on the website or application. This feature provides a visual representation of the user's interactions, making it easier to diagnose issues and understand user behavior.
It also includes controls for playback speed (1x, 2x, 4x, or 8x) and an option to skip inactive periods.
You can navigate to specific points in the session quickly by clicking anywhere on the timeline view.
User Actions
This tab captures all the actions performed by the user during the session. It includes:
- Action Name: Describes the type of action (click, scroll, page load, error, etc.).
- Name: Displays the specific element or URL associated with the user action, such as a clicked button, input field, or loaded webpage.
- Time: Shows when the action took place.
- You can filter the events by type using the Event Type drop-down menu. This allows you to focus on specific types of user actions, such as only clicks or scrolls.
- Additionally, use the search bar to find events related to specific HTML elements, error messages, or timestamps.
DOM Events
The DOM Events tab captures and lists all the Document Object Model (DOM) events that occurred during the user session.
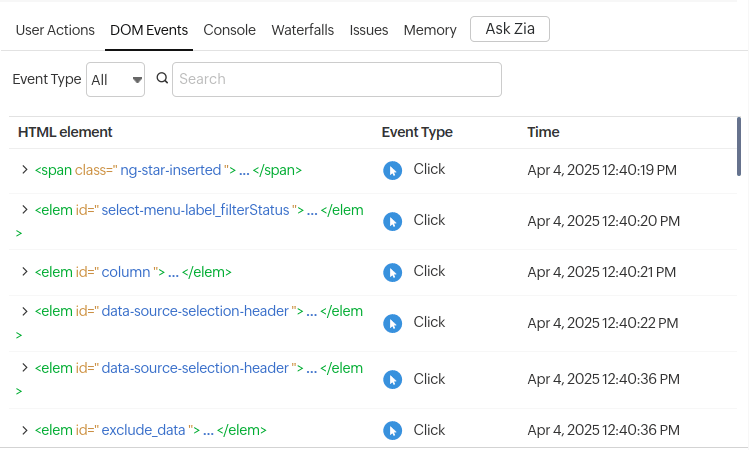
- HTML element: The HTML element involved in the event.
For example, <elem id="data-source-selection-header"> indicates that the "data-source-selection-header" element was clicked. - Event Type: The type of DOM event that was captured.
- Time: The exact timestamp of when the event occurred.
- You can filter the events by type using the Event Type drop-down menu. This allows you to focus on specific types of interactions, such as only clicks or scrolls.
- Additionally, you can use the search bar to find events related to specific HTML elements or timestamps.
Console
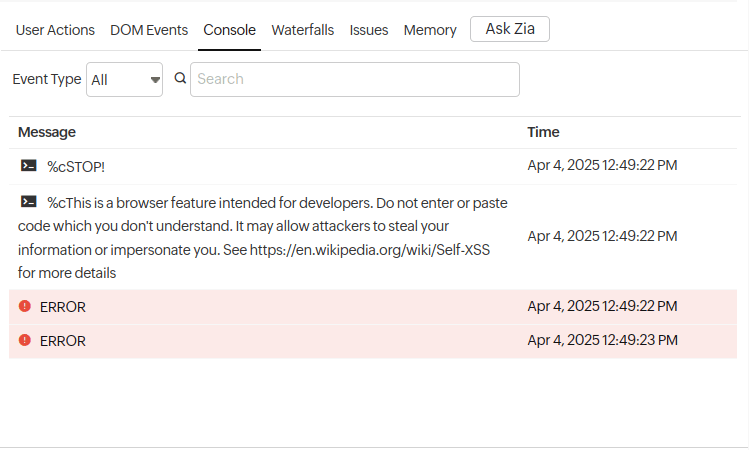
This tab provides a detailed log of console messages recorded during a user session. With the help of these messages, you can gain insights into the technical aspects of user sessions, enabling proactive identification and resolution of issues that impact your web application's performance and reliability.
- The Event Type drop-down allows you to filter the console messages by their type, such as errors, warnings, or other log levels. This helps in focusing on specific types of issues.
- A search functionality is provided to quickly locate specific messages within the console logs by keyword or phrase.
Waterfalls
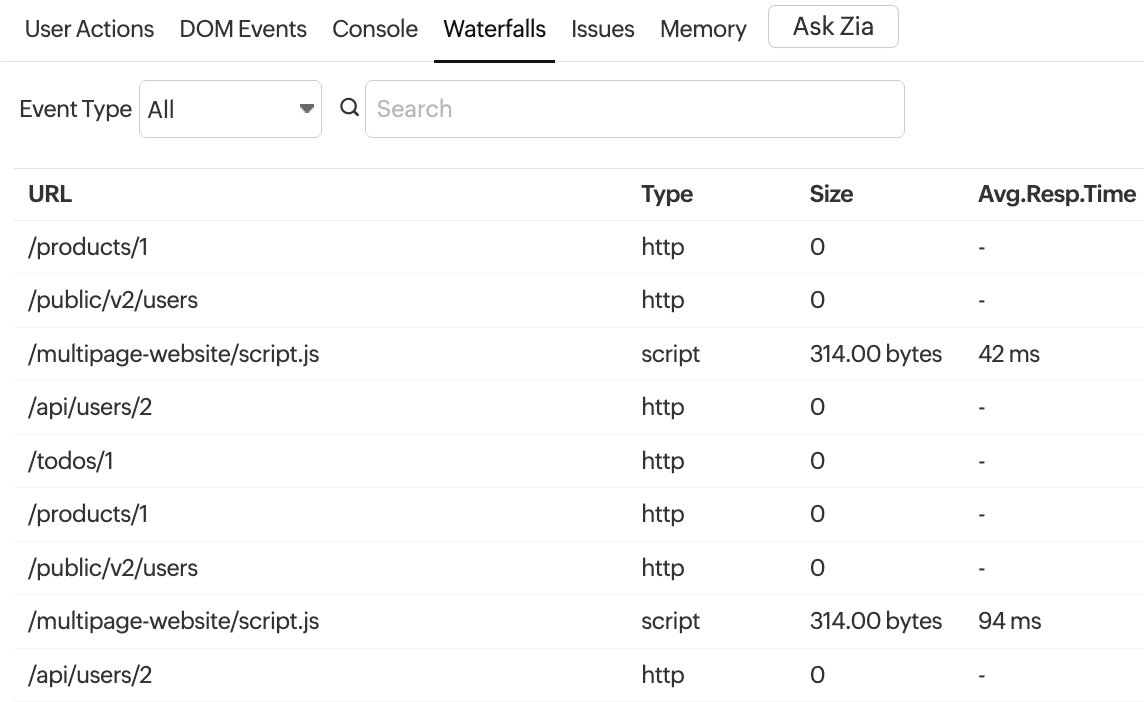
This section displays a list of resources (such as scripts, stylesheets, and images) that were loaded during the user's session. This typically includes the URL, type, size, and average response time for each resource. It helps in understanding how these resources impact the page load time and overall performance of the application.
- URL: The endpoint or resource requested (e.g., API calls, scripts, stylesheets, or images).
- Type: The category of the request (e.g., HTTP, script, or CSS).
- Size: The amount of data transferred for the request, shown in bytes or kilobytes.
- Avg. Resp. Time: The average response time taken for the request to complete.
- The Event Type drop-down allows you to filter the network requests based on their type, such as code snippets, HTTP calls, images, fonts, or source maps. This helps in isolating specific types of resources to analyze their impact on page performance.
- A search functionality is provided to quickly locate specific network requests by entering a keyword or phrase, making it easier to debug loading issues.
Issues
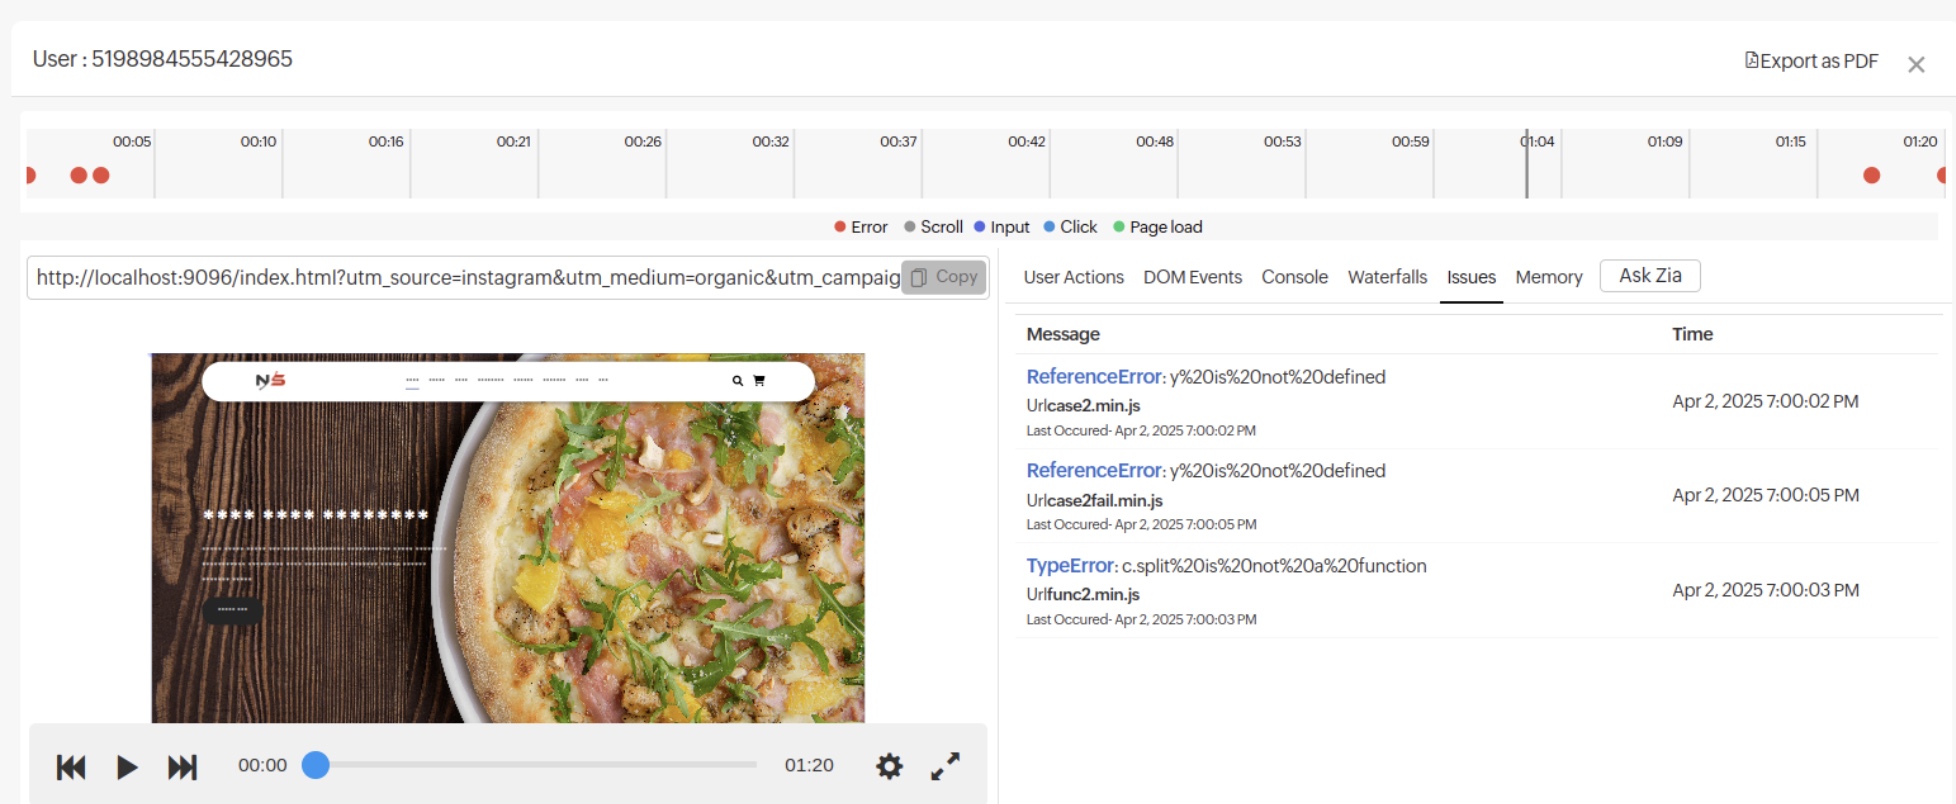
This section captures and displays any errors encountered by the user during their session. This section also provides detailed information about various issues, such as JavaScript errors, network failures, and other problems that may affect the user's experience on the website or application.
- The timeline at the top shows when each error occurred during the session, marked with red dots.
- It helps in correlating errors with user actions and other events (e.g., scrolls, inputs, clicks, or page loads) that are marked with different colored dots.
Memory
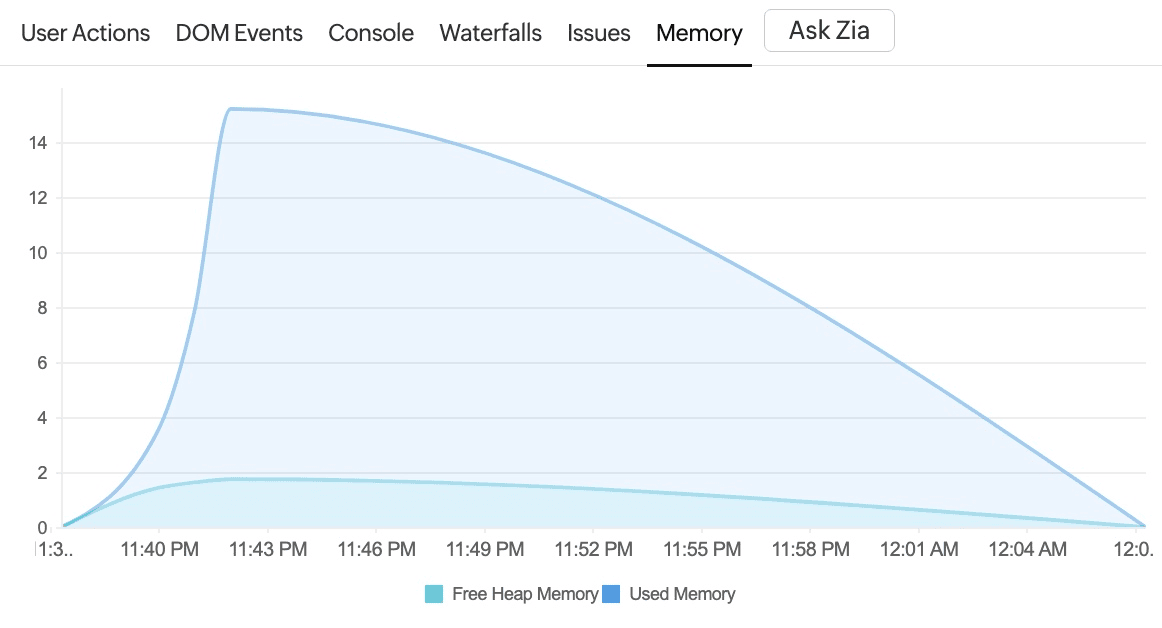
This section provides a detailed view of the memory usage during a user's session. It helps developers understand how the application is consuming memory over time and identify potential memory leaks or inefficiencies.
- Free Heap Memory: The amount of memory that is available for the application to use.
- Used Memory: The amount of memory that is being used by the application.
Key insights:
- A steady increase in used memory without corresponding decreases might indicate a memory leak.
- Also, sudden spikes in memory usage can point to specific actions or events in the application that require significant memory.
Network section
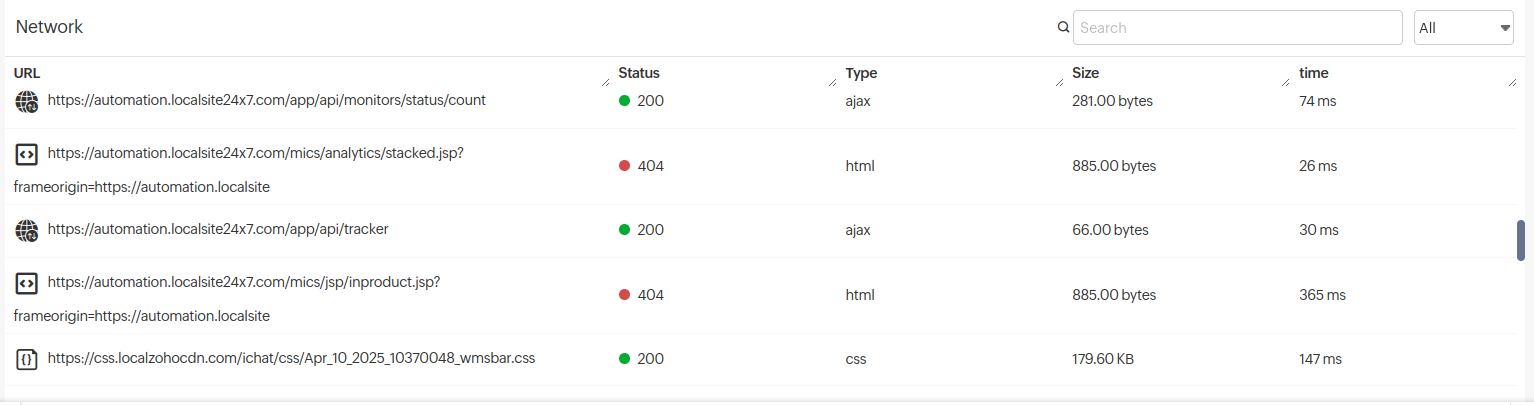
The Network section provides a detailed view of all network requests made during the user session. It helps in debugging by listing essential details such as:
- URL: The endpoint accessed by the webpage.
- Status: The HTTP status code indicating whether the request was successful (e.g., 200 for success or 404 for not found).
- Type: The type of request, such as AJAX or JavaScript file.
- Size: The size of the response in bytes.
- Time: The time taken to complete the request.
This section helps identify slow or failed network requests that could impact the user experience.