Data Collection Stats
The Data Collection Stats tab provides a detailed data report of the selected RUM application for the chosen time period. The data report is available for the last 30 days.
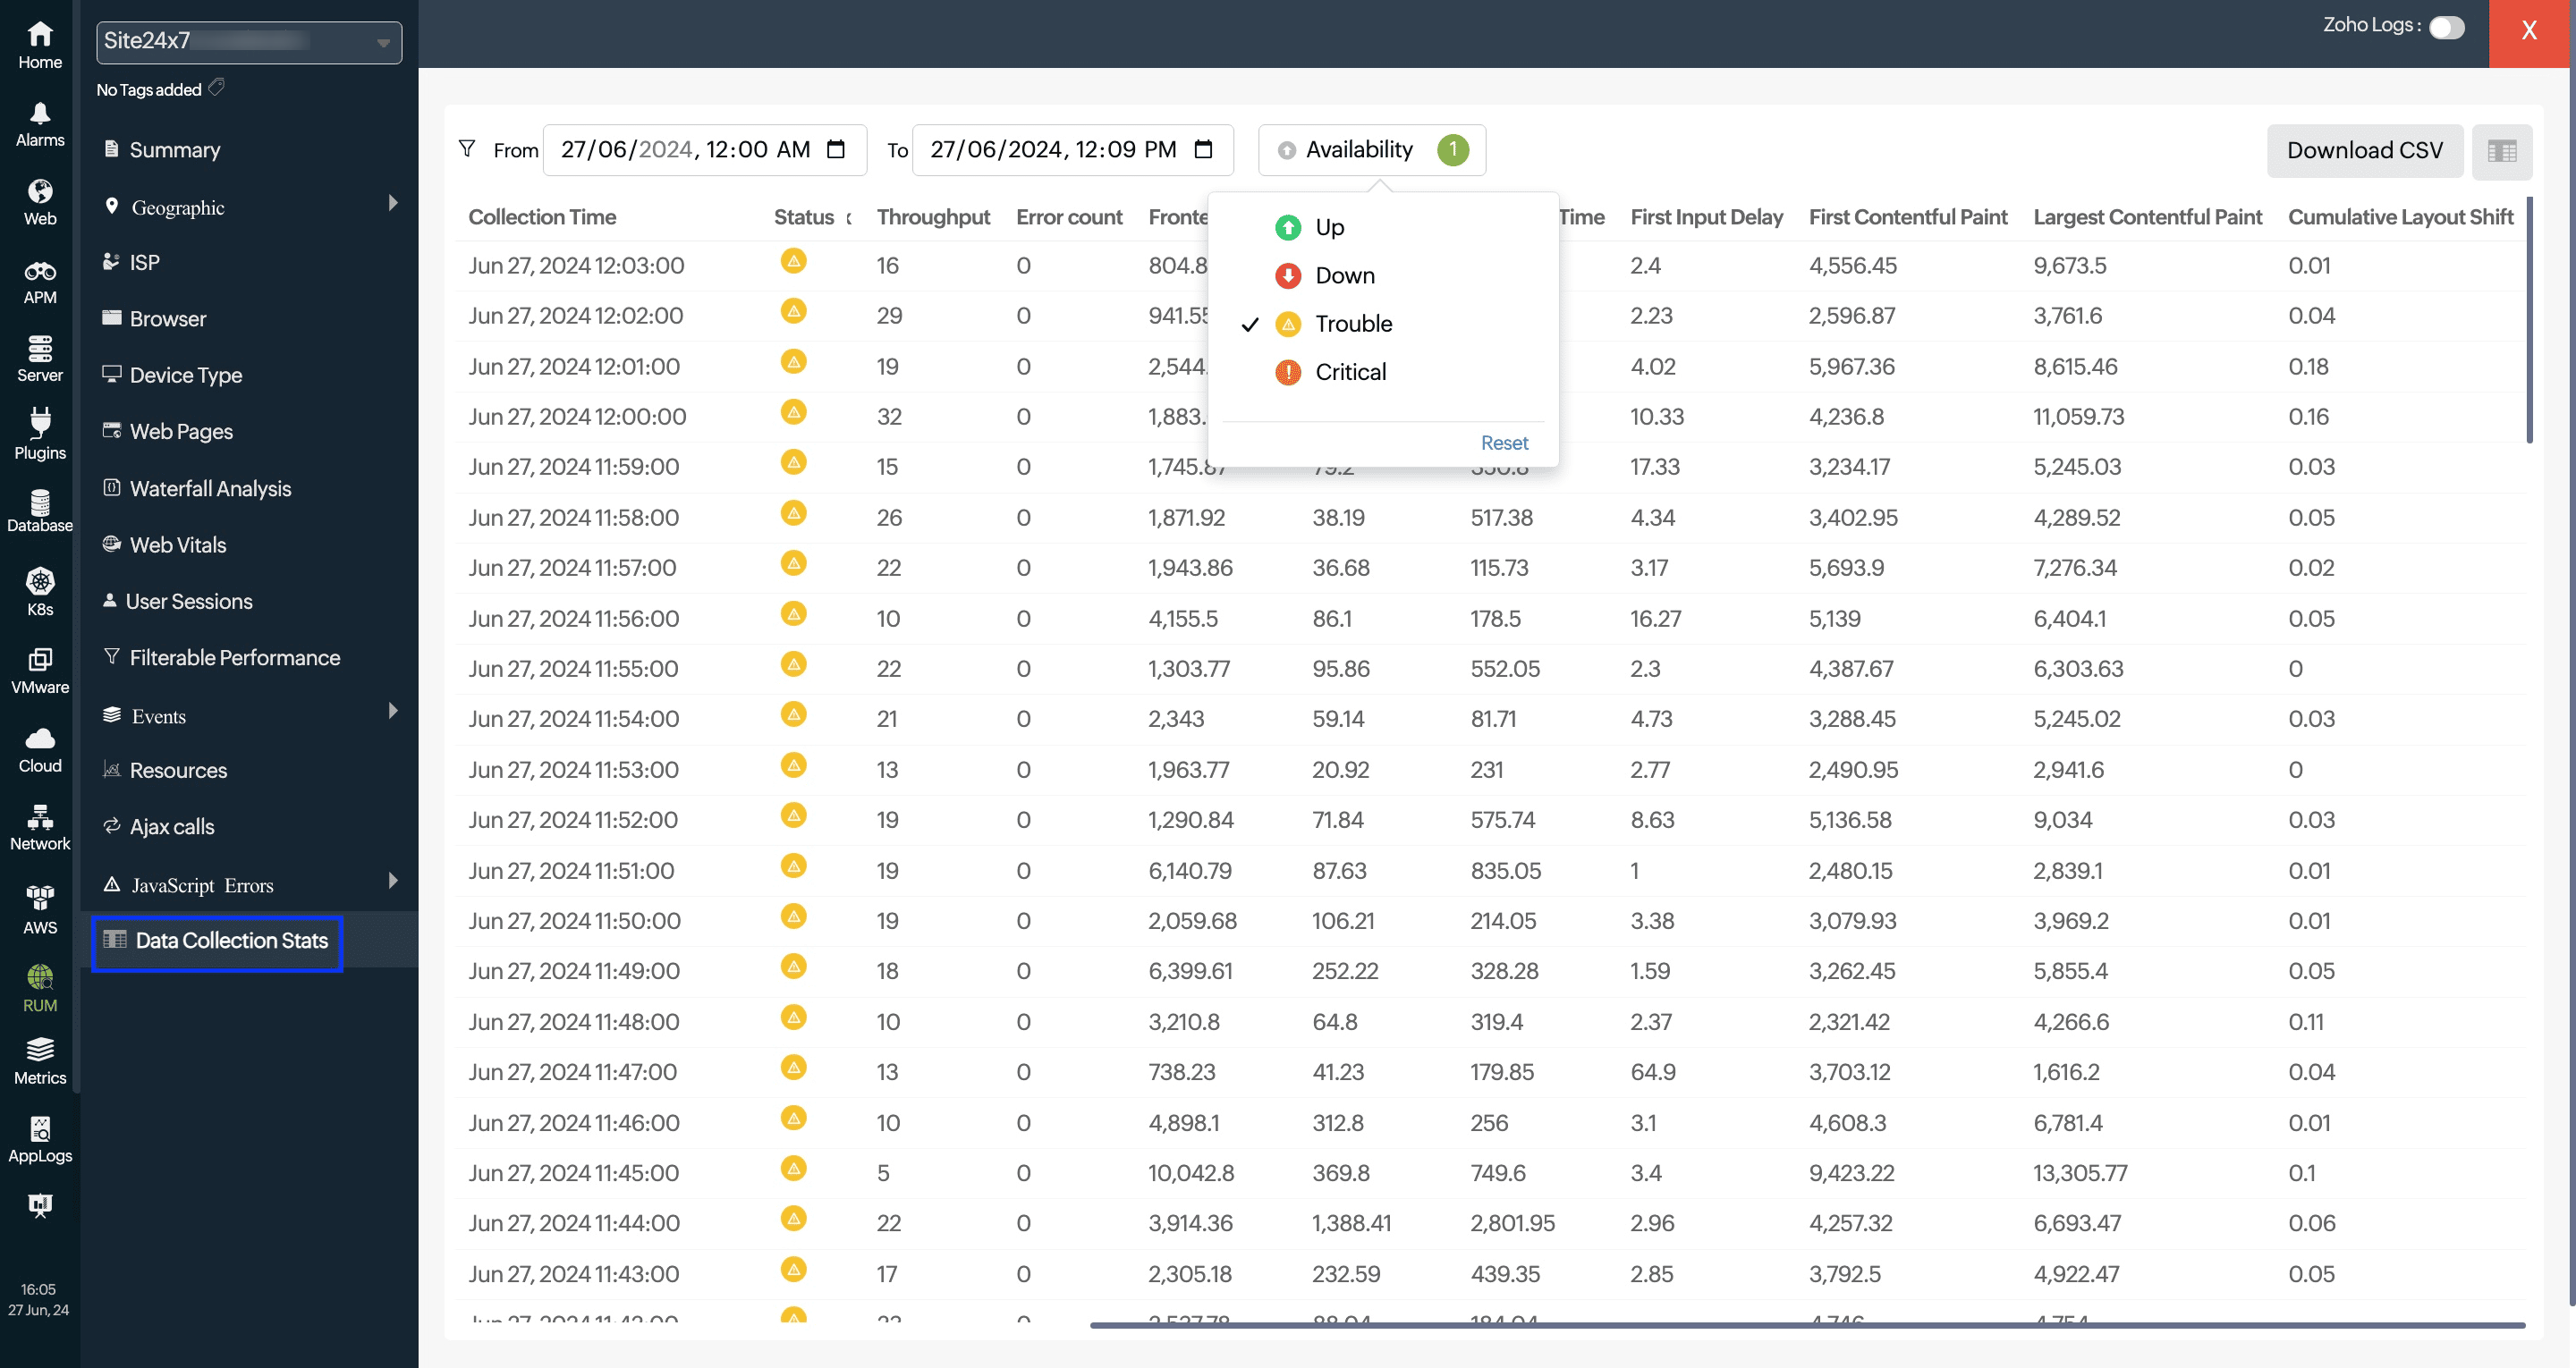
To access this tab, log in to your Site24x7 account > RUM > Your application > Data Collection Stats.
Note
- You can also filter the report based on the monitor status. To do so, click the Availability button and select the status for which you want the report.
- You can use the Download CSV button to export the displayed report.
| Parameters | Description |
|---|---|
| Status | Indicates the overall health or performance status of the application during the collection period. |
| Users | Number of unique users during the specified time. |
| Sessions | Total number of user sessions initiated by users during the specified time. |
| Avg. Resp. Time | Average response time (in milliseconds) for requests made by users. |
| Satisfied | Number of users found the response time satisfactory. |
| Tolerating | Number of users found the response time tolerable. |
| Frustrated | Number of users found the response time frustrating. |
| Pageviews | Total number of pageviews during the specified time. |
| Apdex | The Apdex score based on the response times. |
| Throughput | The number of requests received per minute. |
| Error count | Total number of errors encountered during the specified time. |
| Frontend Time | Average time taken for the frontend (client-side) processing. |
| Network Time | Average time taken for network communication. |
| Backend Time | Average time taken for backend (server-side) processing. |
| First Input Delay | The value that measures the time from a user’s first interaction with the site to when the browser responds. |
| First Contentful Paint | Time taken for the browser to render the first piece of content from the DOM. |
| Largest Contentful Paint | Time taken to render the largest visible content element in the viewport. |
| Cumulative Layout Shift | This value gives the measure of the total movement of visible elements during the page's loading phase. |
Note
The parameters First Input Delay (FID), First Contentful Paint (FCP), Largest Contentful Paint (LCP), and Cumulative Layout Shift (CLS) are the Web Vitals metrics.