Path Analysis
Path Analysis provides a visual representation of how requests flow through your applications. It helps you see which services participate in a transaction, how they interact with each other, and where delays or errors occur. Instead of switching between multiple applications, you get a complete view of the request flow in a single place, from the initial entry point to all downstream services.
Supported application
PHP
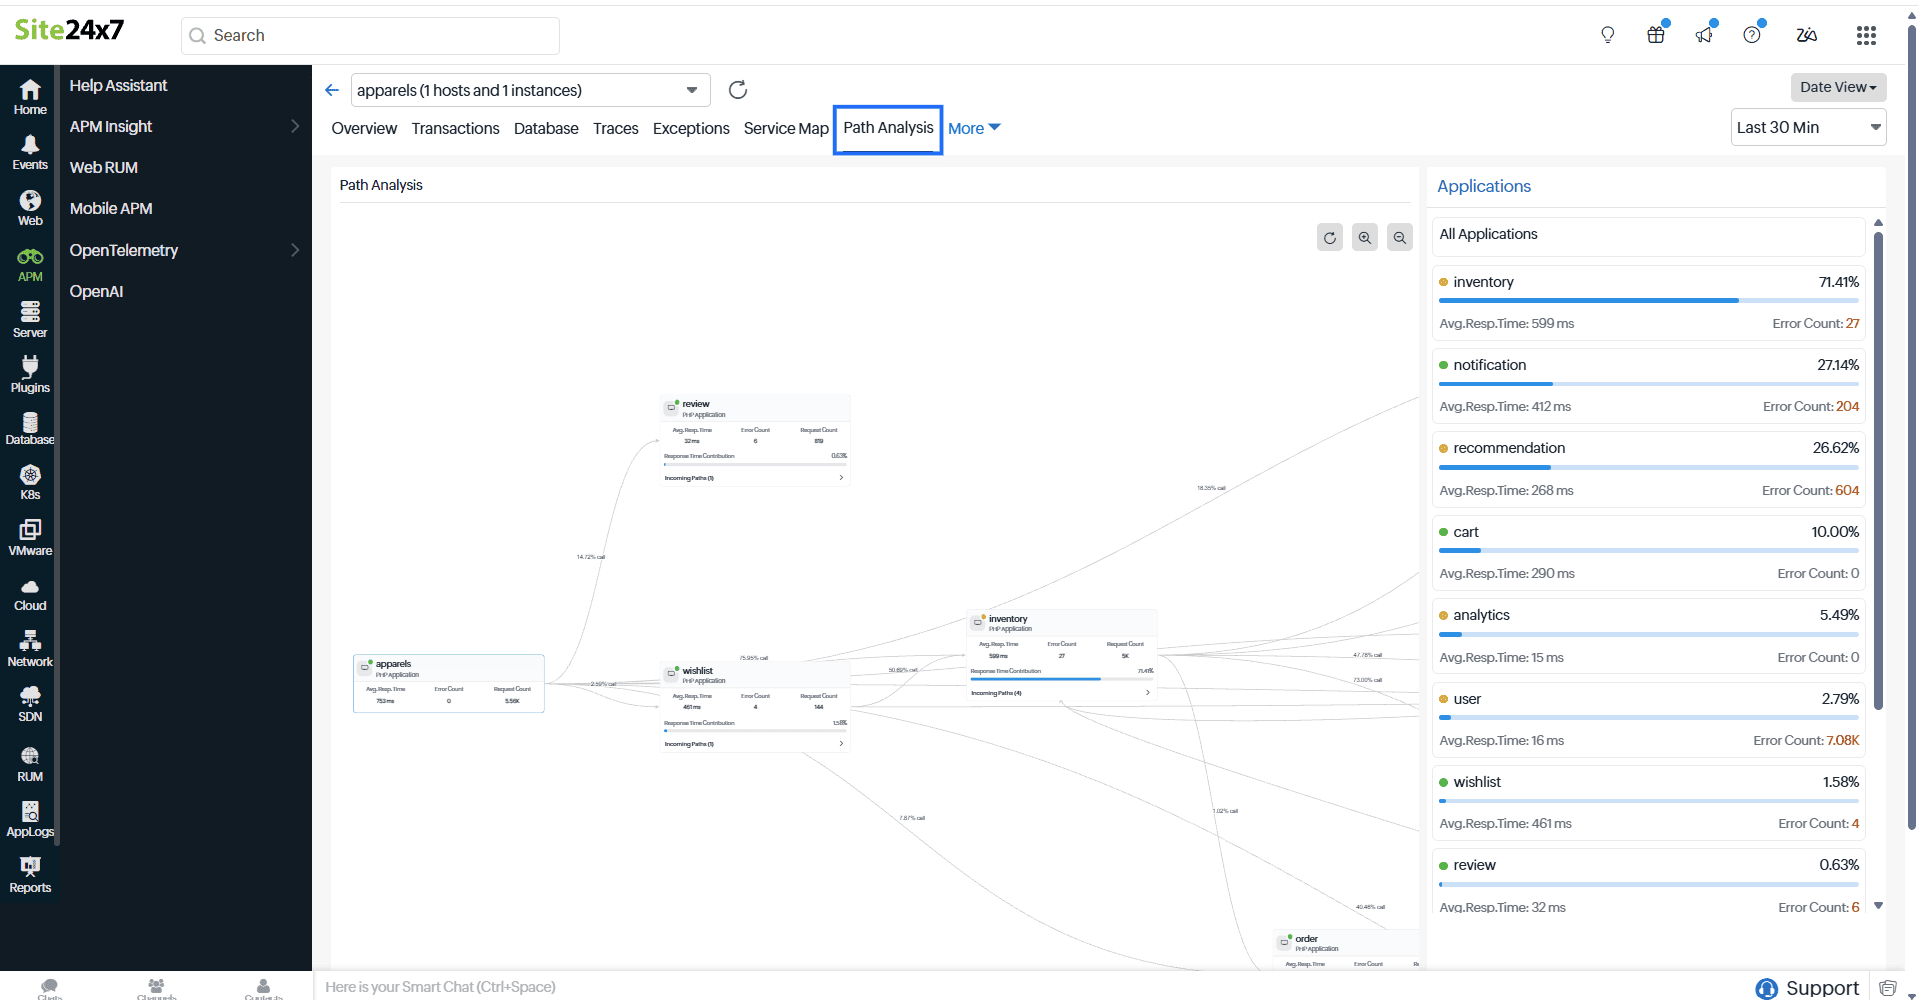
Viewing Path Analysis
- Log in to your Site24x7 account.
- Navigate to APM > APM Insight > Applications.
- Open your PHP application.
- Click the Path Analysis tab.
The Path Analysis tab is displayed only for applications, not for their instances.
Use case
On a large e-commerce platform, customers experience delays while placing orders. Each request flows through multiple services such as User, Cart, Order, Inventory, Payment, and Shipping. The IT operations team first looks at the overall application setup and checks how services are connected. Everything appears normal, and no apparent issues stand out.
Although the slowdown is clearly affecting users, the team struggles to trace it back to the exact application or internal process responsible. That’s when the team turns to Path Analysis. By following the complete journey of a single request, the team can see each step the request takes and how much time is spent along the way. This makes it easy to backtrack, identify the exact point of delay, and quickly pinpoint the application component causing the slowness.
Path Analysis overview
Let's explore the Path Analysis tab in detail.
Map controls and navigation
You can use the following controls to interact with the Path Analysis map:
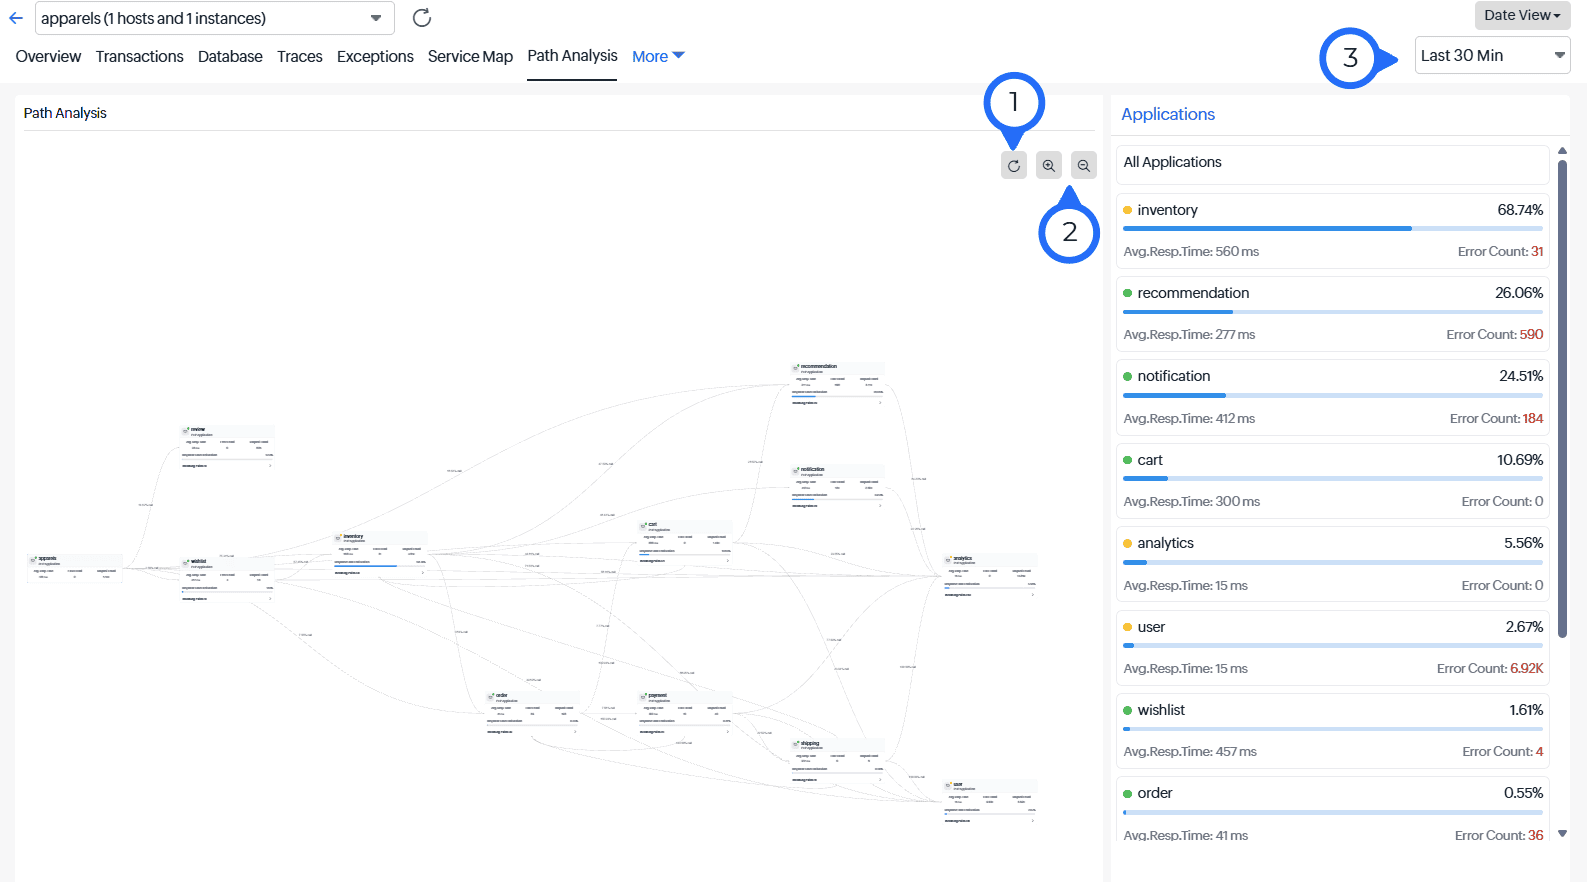
- Refresh view: Regardless of your current view, zoom level, or navigation, clicking Refresh view restores the default layout.
- Zoom in and Zoom out: These controls allow you to adjust the map view for better visibility and detailed analysis.
- Time range selector: By default, the map displays data from the last 30 minutes. You can use the drop-down to select a different time range based on your analysis needs.
Application nodes on the map
On the Path Analysis map, each application is represented as a node, providing a clear view of how requests flow across your environment. Every node displays key information, including:
- Application name: Name of the monitored application or service
- Application status: The health of the application using color codes for quick visual identification
- Type of the application: The application type (for example, a PHP application)
- Avg.Resp.Time: The average time taken by the application to respond to requests
- Error Count: The total number of failed or erroneous requests
- Request Count: The total number of requests processed by the application
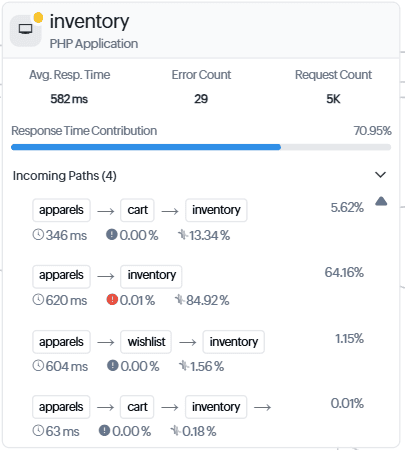
The map provides context by displaying one level of the incoming application before the selected application along with all the downstream applications that receive requests from it. This helps you understand where requests come from and where they go next.
When you hover over an application node, the corresponding request flow is highlighted, making it easy to see the connection between applications. You’ll also see the exact percentage of HTTP calls flowing through that connection, helping you understand how traffic is distributed.
For downstream applications, the map shows the percentage each one contributes to the overall response time. It also displays the different incoming paths through which requests reach that application, giving you deeper insight into request dependencies.
You can restructure the flow layout at any time to improve visibility and make it easier to analyze complex application flows.
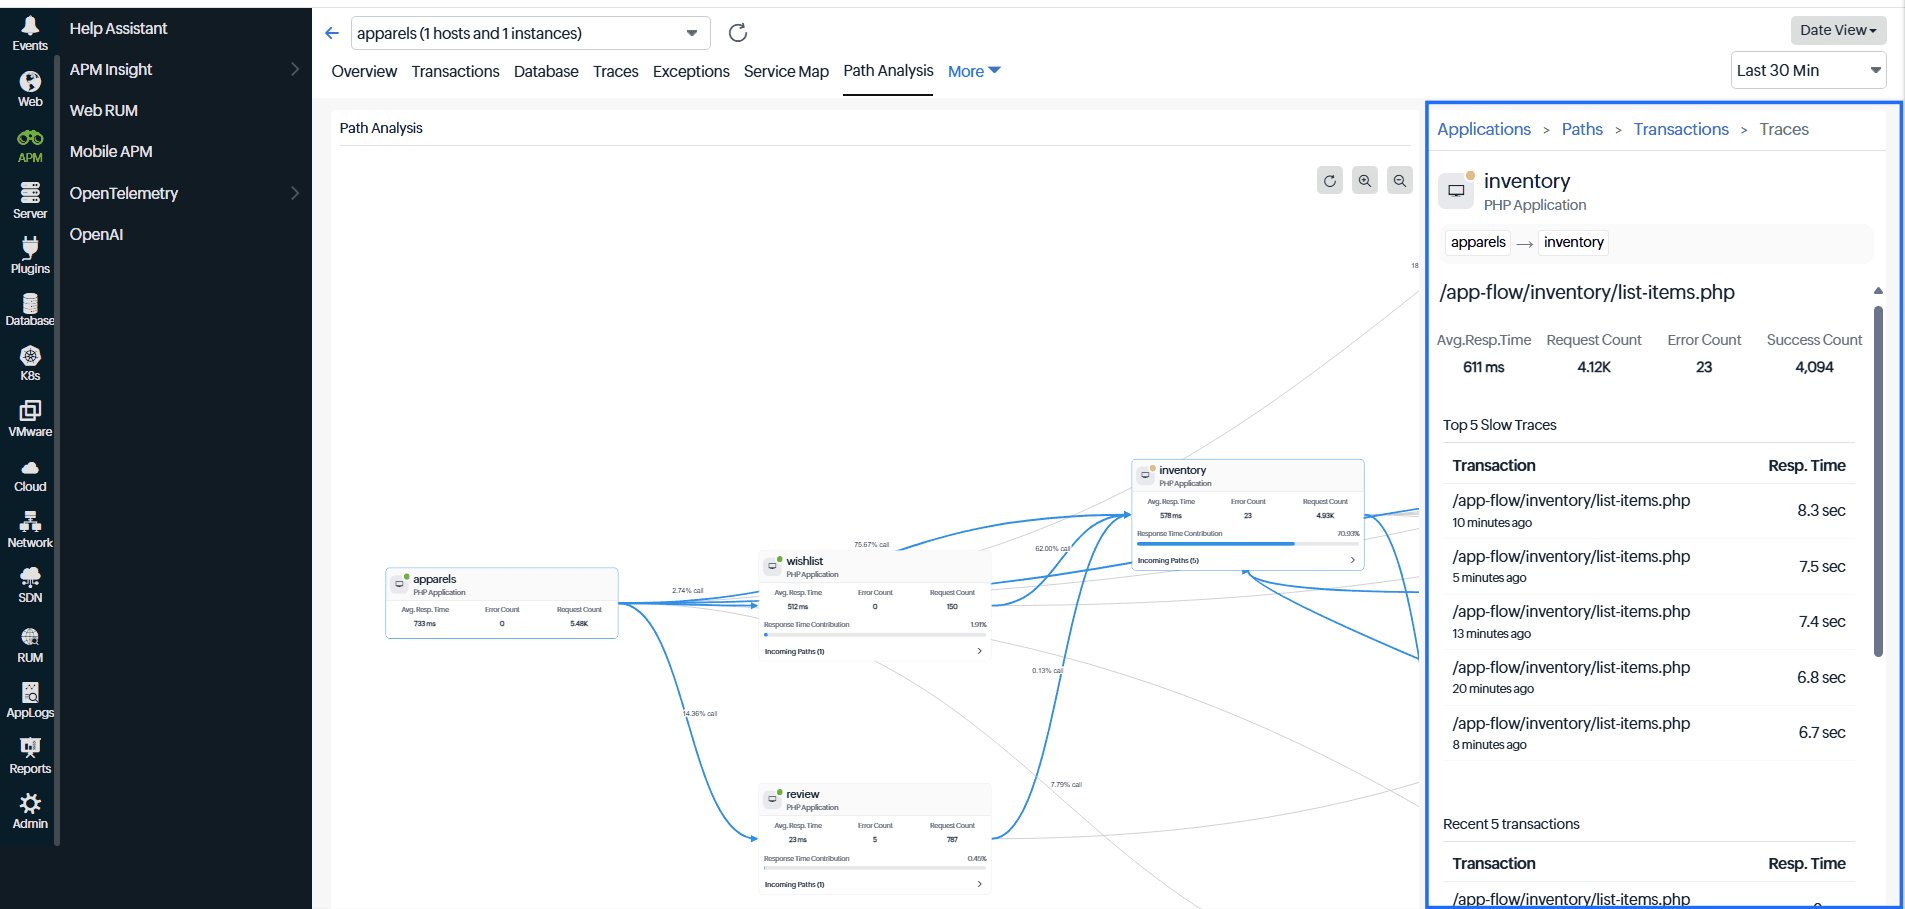
Application panel overview
The right panel complements the map by providing detailed information about applications, incoming paths, and transactions. It lists all the applications involved in the selected path along with their status (color-coded), Avg.Resp.Time, Error Count, and progress bar showing the response time contribution. This helps you quickly identify which applications are impacting overall performance.
When you click the incoming path in any application, the panel updates to show detailed information about that particular path. You can explore individual paths further and view the transactions associated with each one.
Selecting a transaction reveals detailed metrics such as the Avg.Resp.Time, Error Count, Request Count, and Success Count. This allows you to evaluate the performance and reliability of that particular transaction.
The panel also highlights the Top 5 Slow Traces, the Recent 5 transactions, and the Top 5 Error traces. Each of these entries includes the transaction name and its corresponding metrics. Clicking any transaction takes you directly to the Traces tab, where you can view the complete trace details for deeper troubleshooting and analysis.