Compare Reports
Analyze your reports with insightful data by comparing the application's performance over a specific time period. Comparing Reports enables you to identify redundant errors and remove potential bottlenecks.
To Compare Reports:
- Log in to the Site24x7 web client.
- Navigate to APM > APM Insight > Applications.
- Select your application and click the Date View dropdown.
- Choose Compare View.
- Specify the date and time range you wish to compare, then click Apply.
- Click on the relevant graphs to explore detailed metrics and gain deeper insights.
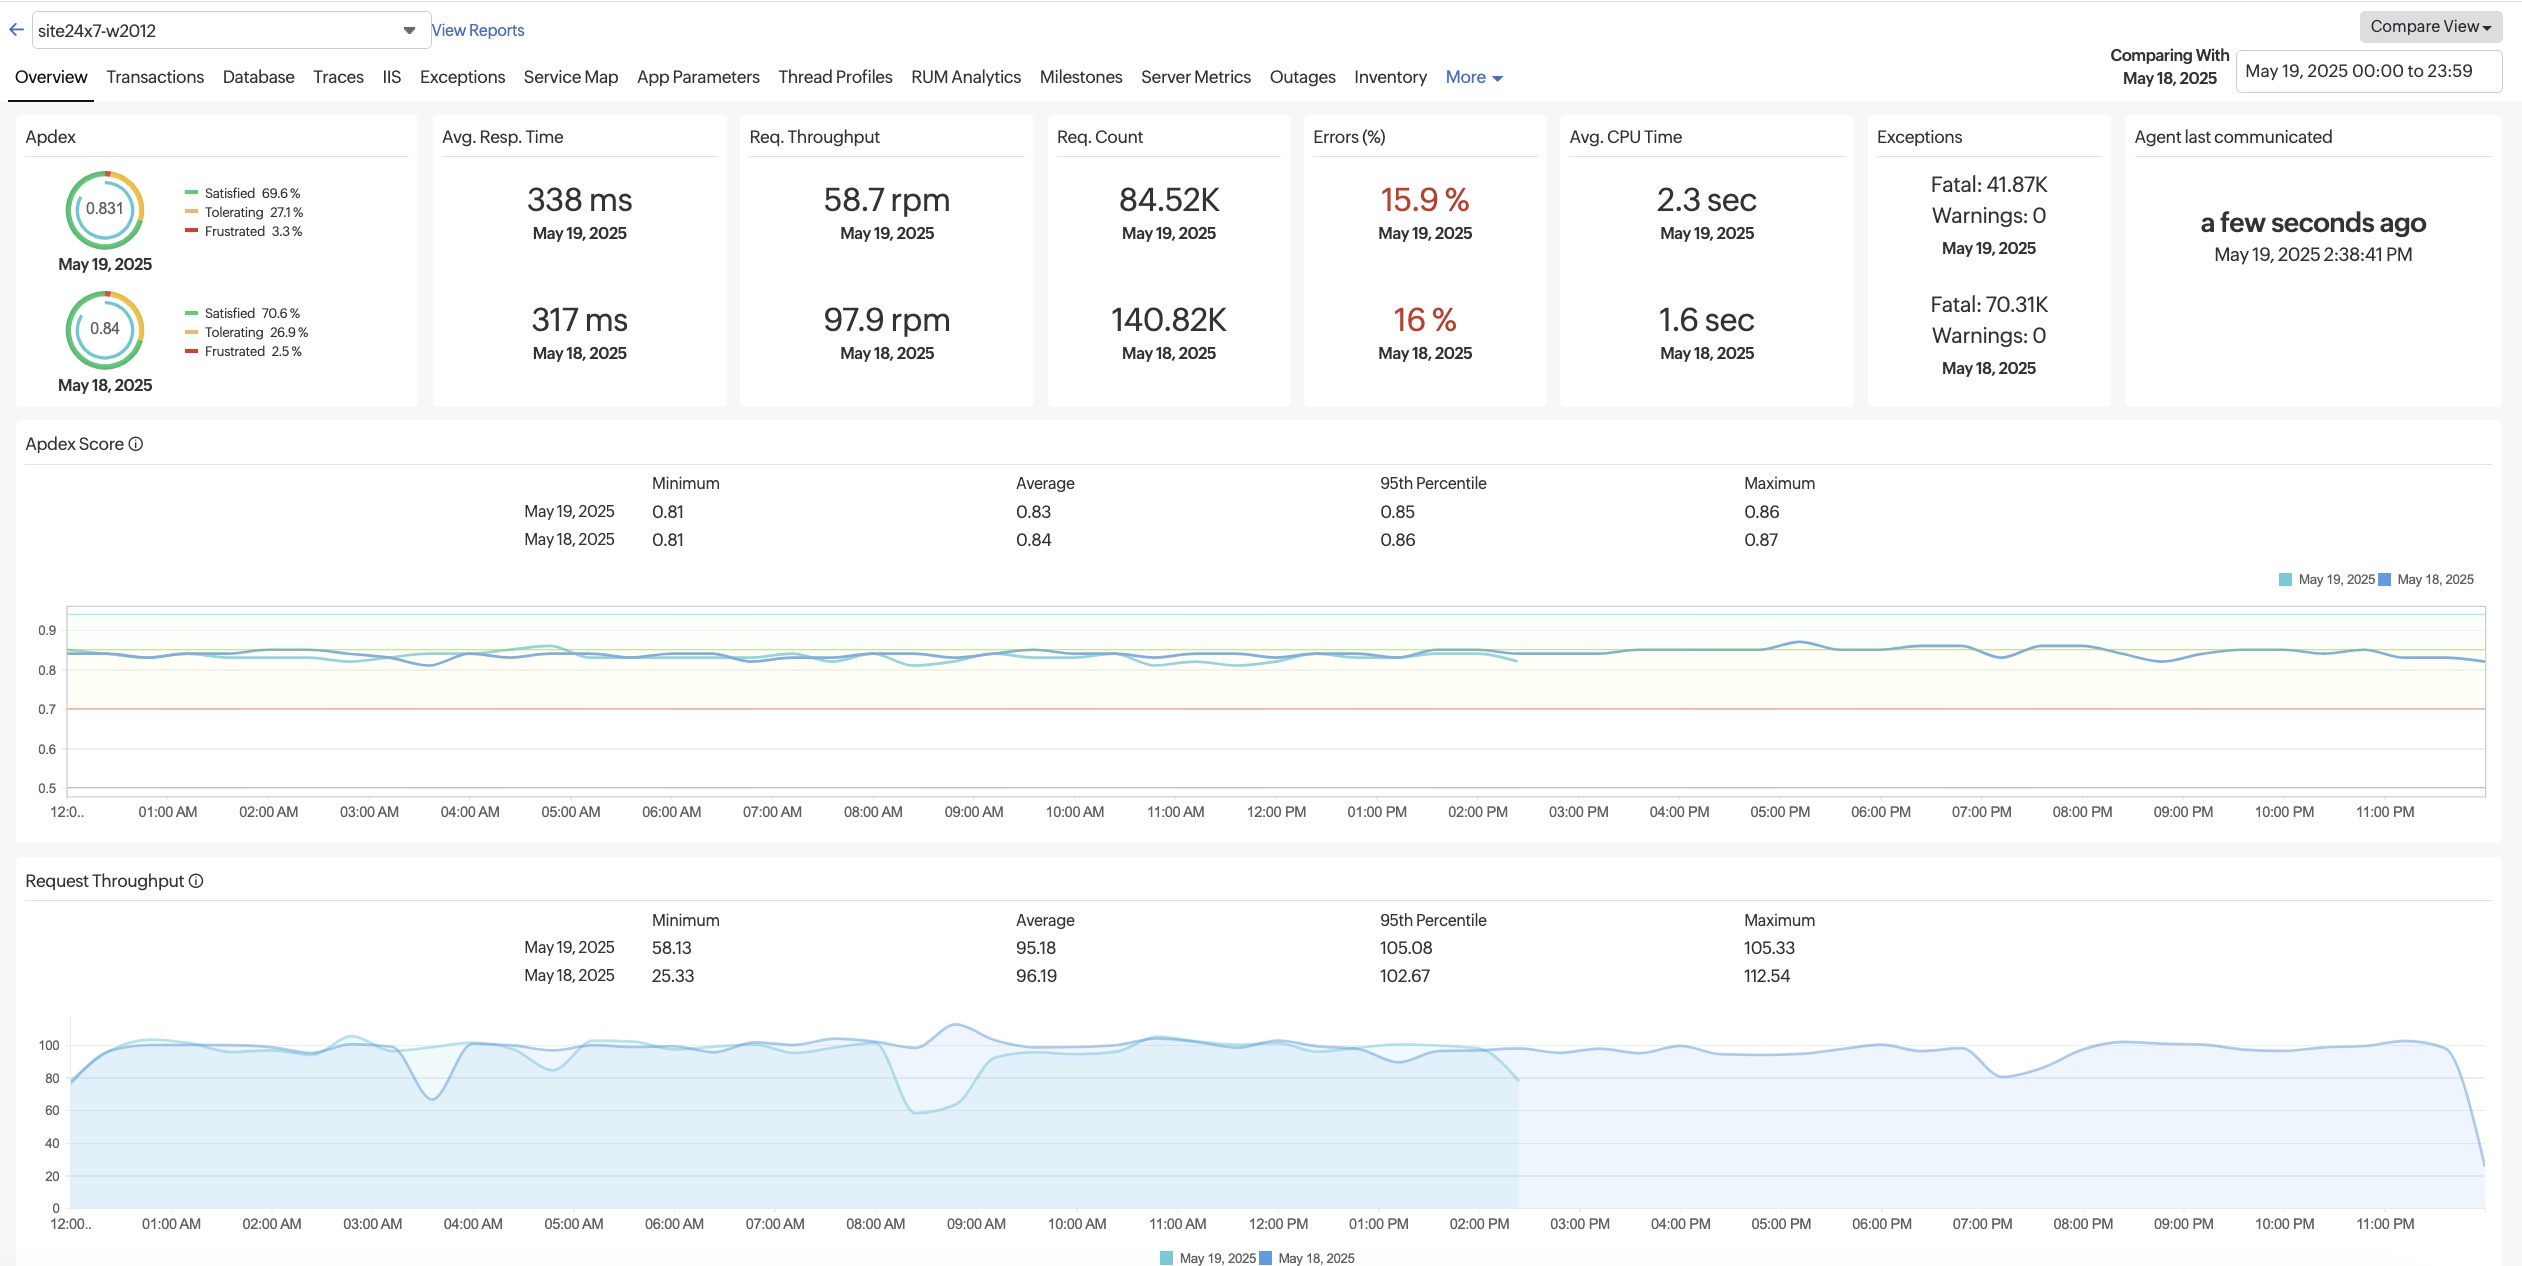
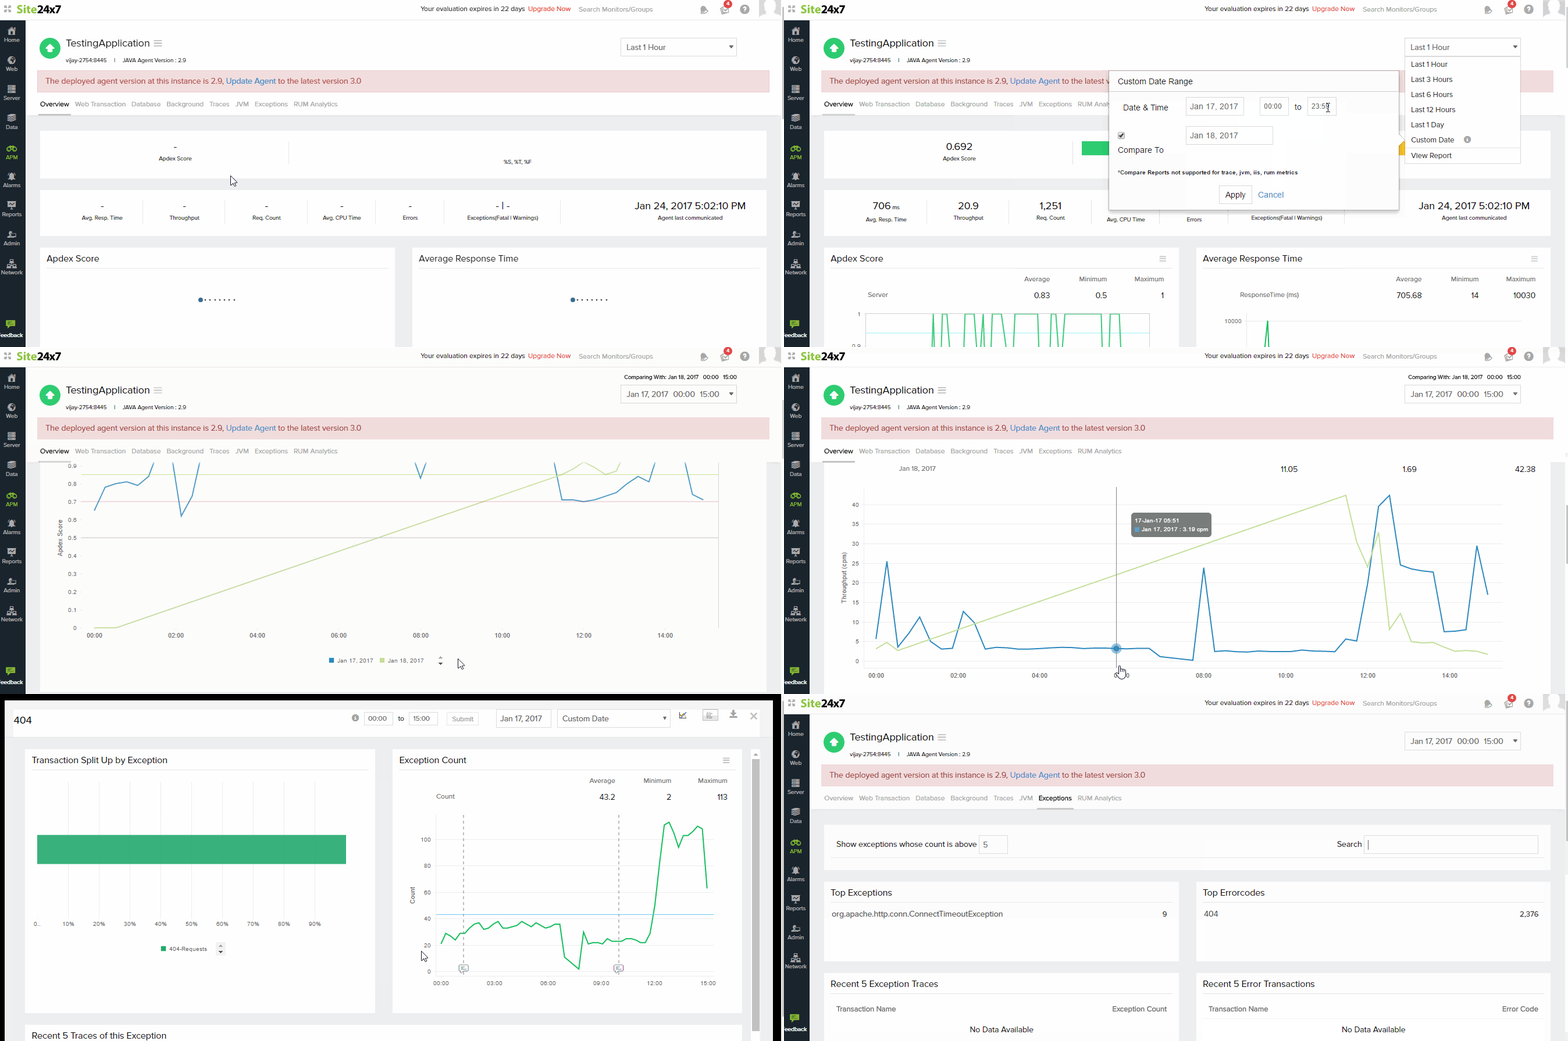
Overview:
- The Overview tab provides a comprehensive outlook on metrics that are being compared, namely, Apdex Score, Average Response Time, Throughput, App Server Split Up, Exception Split Up and HTTP Error Split Up.
- Click on the individual graphical plots or bar graphs to find out more about the respective metrics
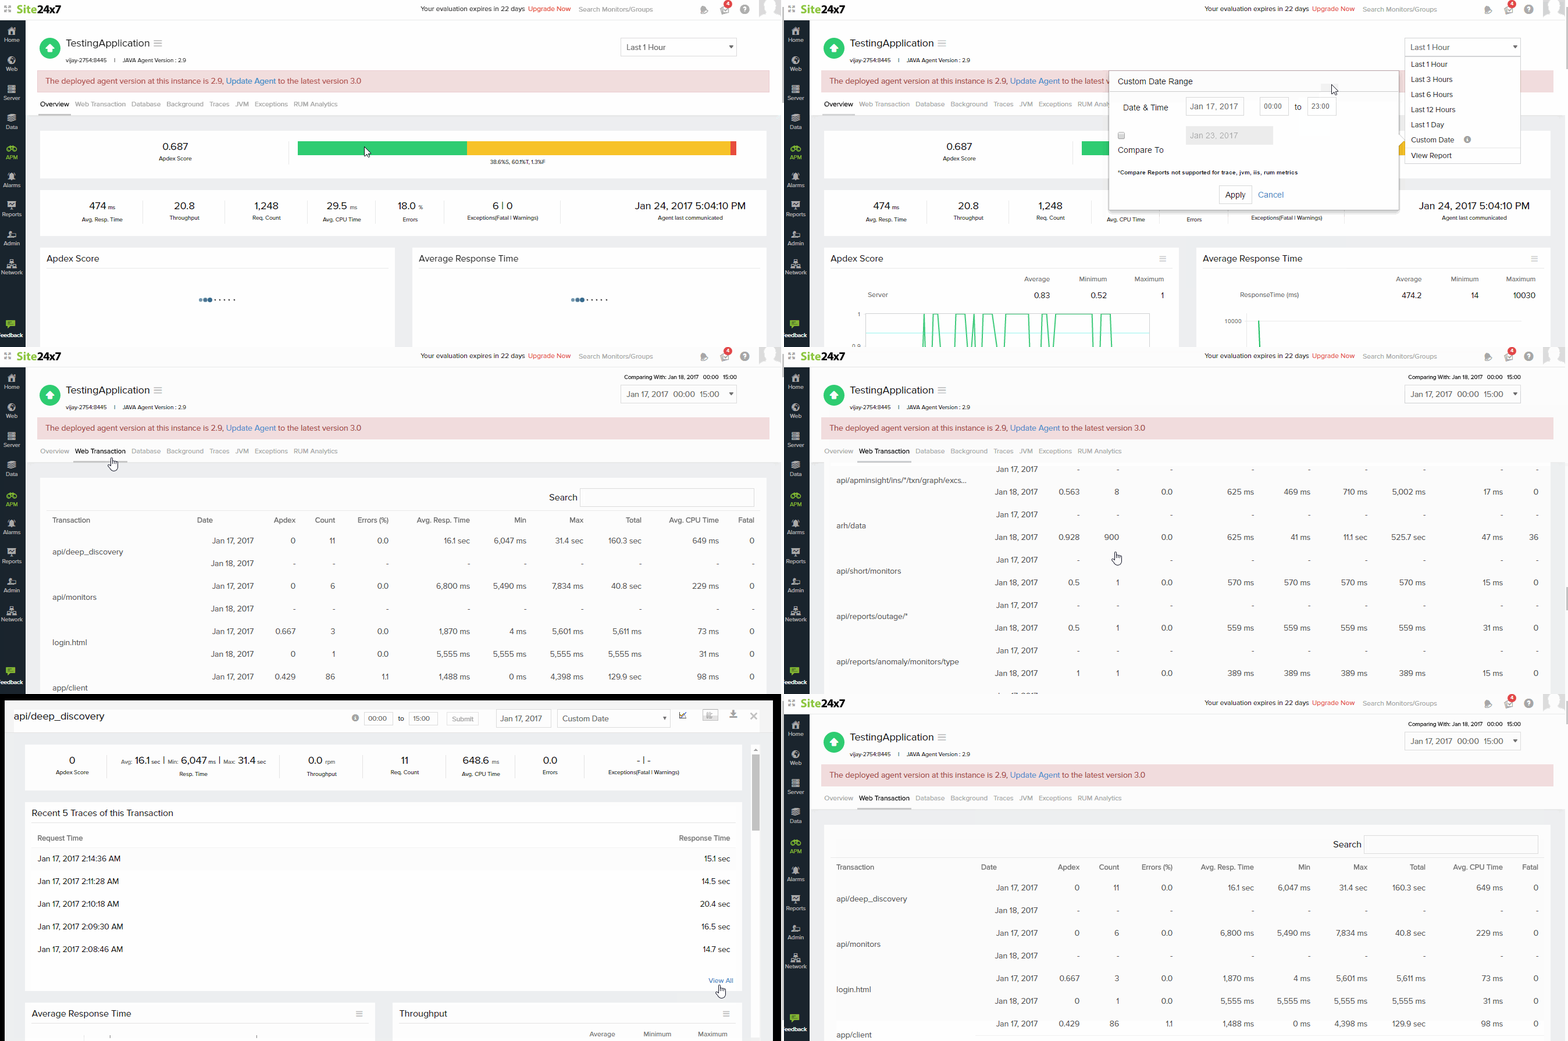
Web Transaction:
- This tab lists out all transactions for the chosen dates in the respective time period
- Individual transaction details can be viewed by clicking upon the respective transactions
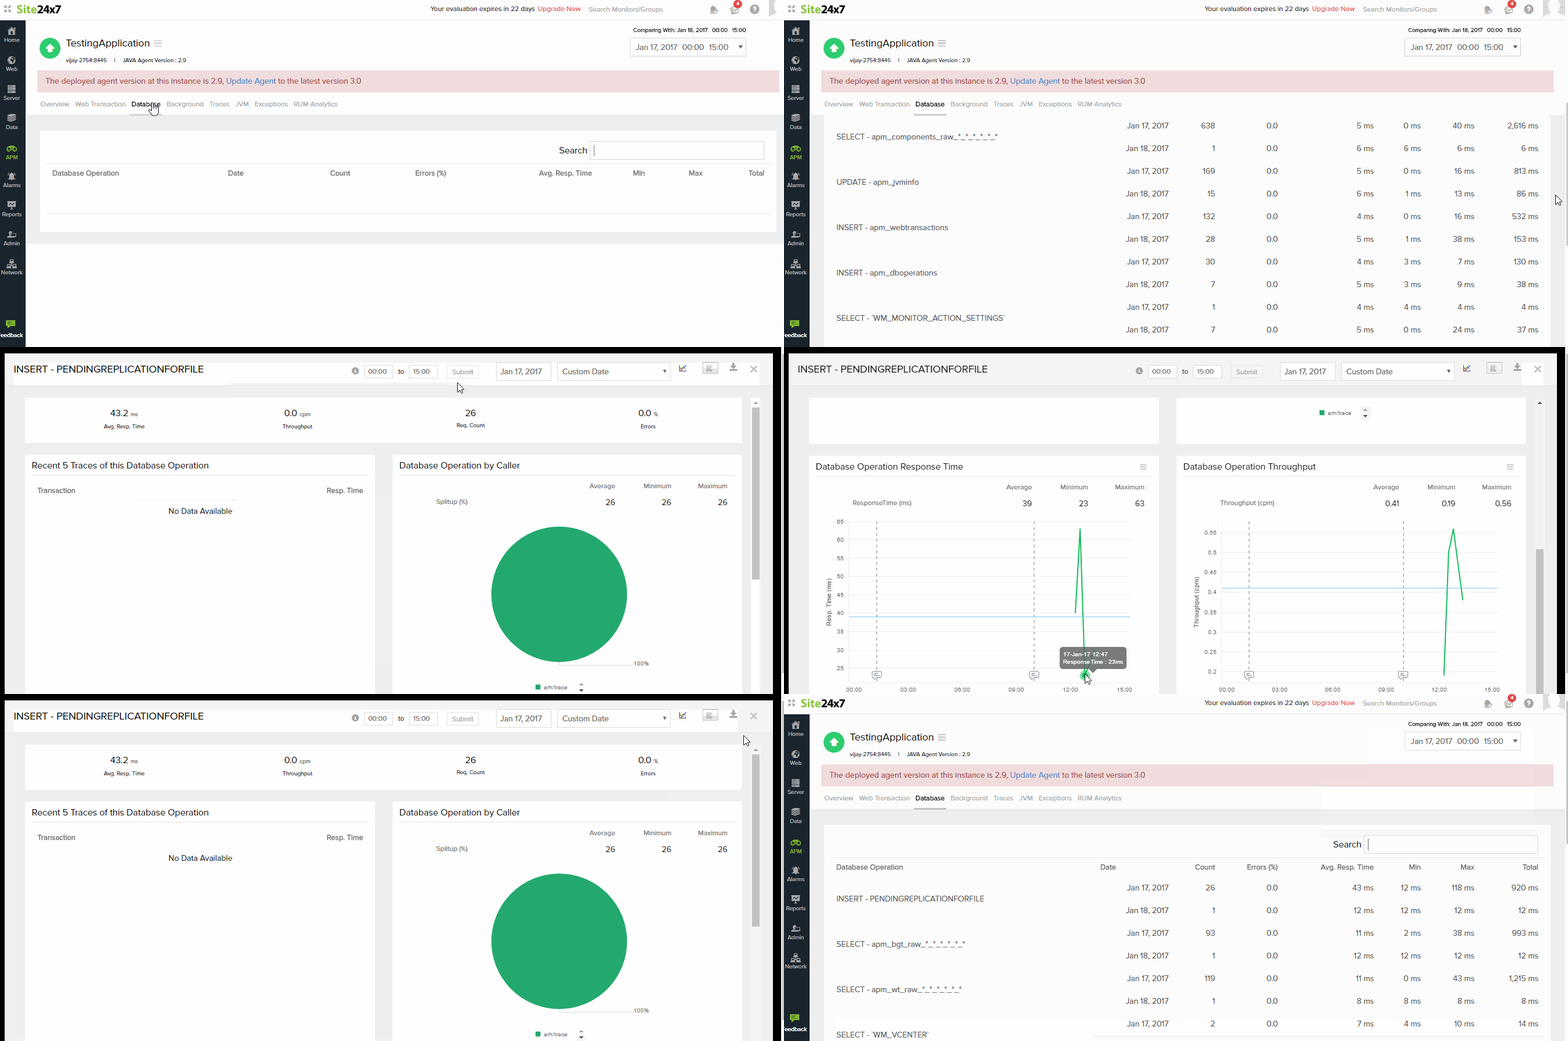
Database:
- This tab lists out database operations for the chosen dates in the respective time period
- Click on the respective Database operation to view detailed information about it
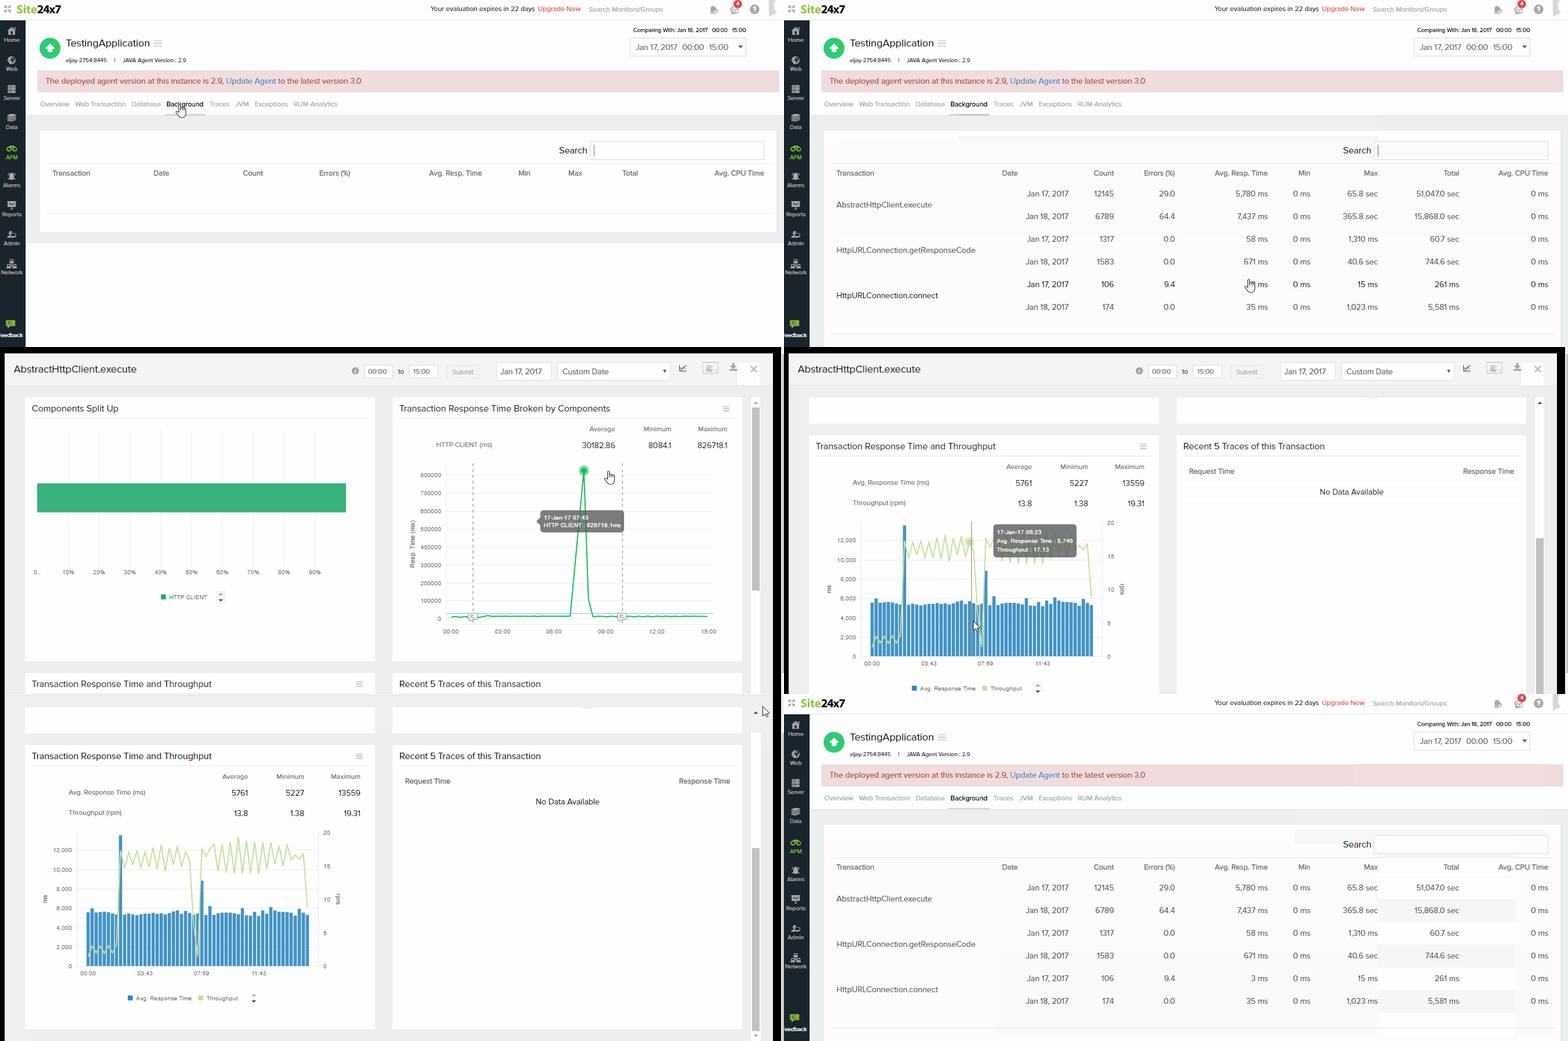
Background:
- This tab lists out background transactions for the chosen dates in the respective time period
- Details on individual transactions can be viewed by clicking upon the respective transactions
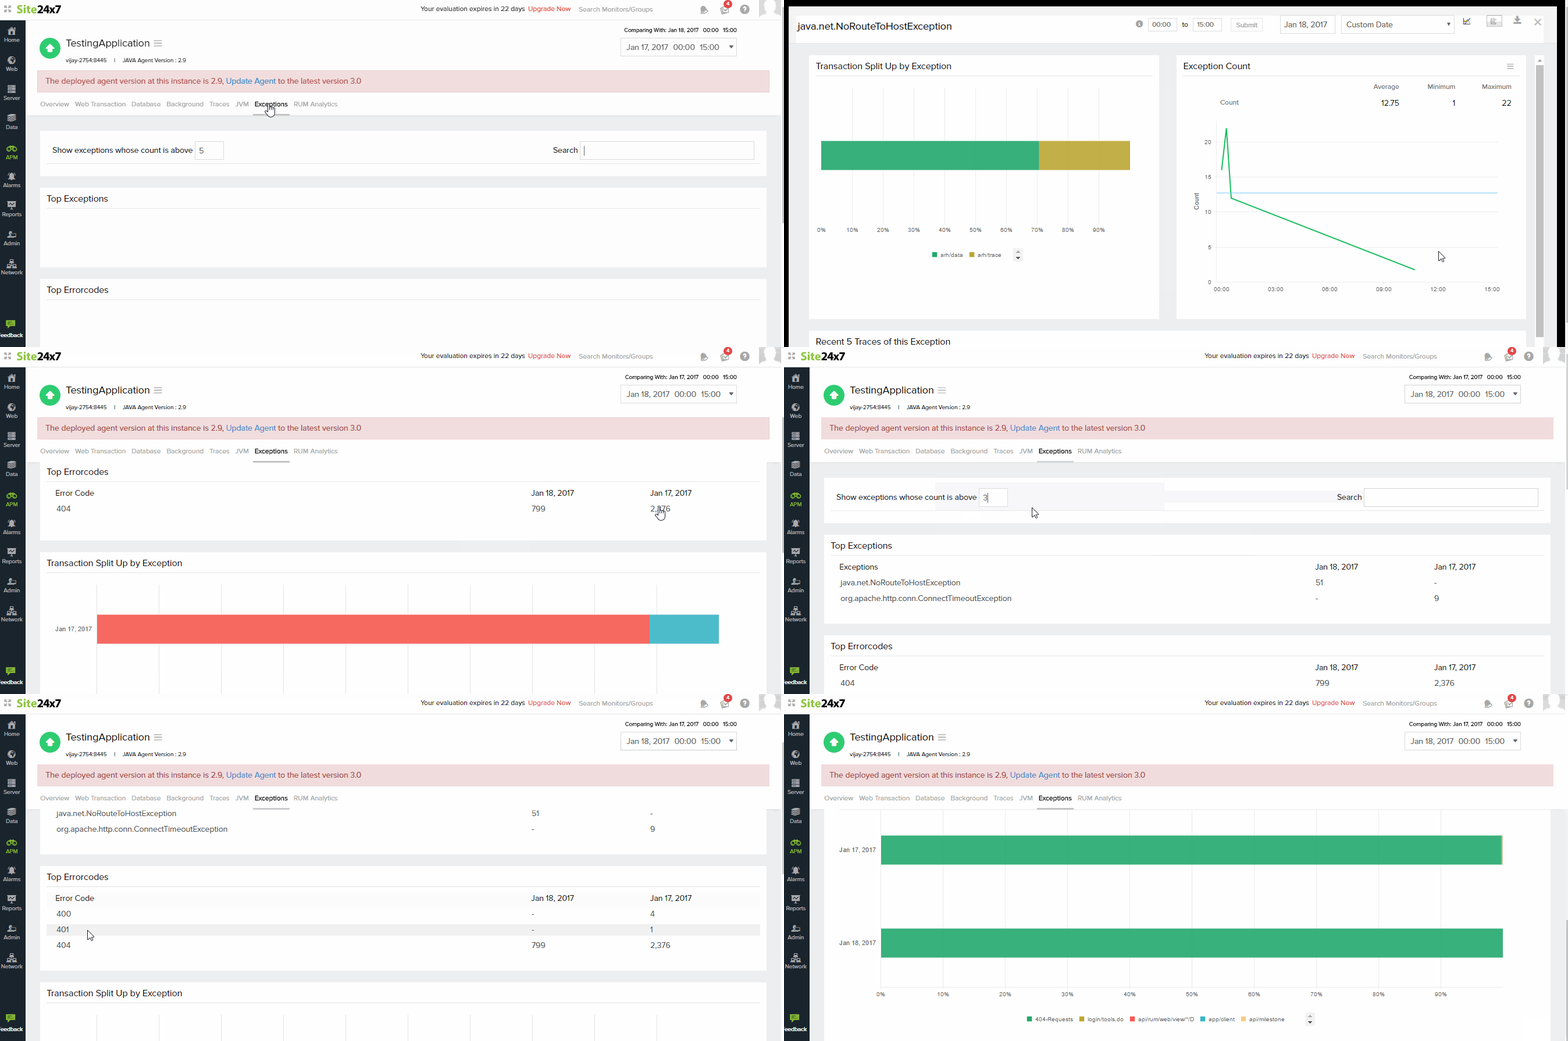
Exceptions:
- The exceptions tab lists out the Top exceptions, Error Codes, Transaction Split up by Error codes and Exceptions
- Transaction Split ups are represented by graphical bar codes
- Click on the respective exception to view detailed information about it
-
On this page
- Overview
- Web Transaction
- Database
- Background
- Exceptions
